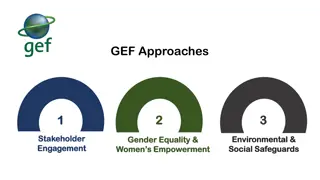
Stakeholder Engagement for Students with Disabilities under IDEA
Explore stakeholder engagement strategies for students with disabilities under IDEA, covering graduation rates, dropout prevention, and post-school outcomes. Learn about meeting norms, input options for parents/guardians, and the Individuals with Disabilities Education Act Part B. Also, delve into the State Performance Plan and Annual Performance Report to understand how states implement IDEA.

Download Presentation

Please find below an Image/Link to download the presentation.
The content on the website is provided AS IS for your information and personal use only. It may not be sold, licensed, or shared on other websites without obtaining consent from the author. If you encounter any issues during the download, it is possible that the publisher has removed the file from their server.
You are allowed to download the files provided on this website for personal or commercial use, subject to the condition that they are used lawfully. All files are the property of their respective owners.
The content on the website is provided AS IS for your information and personal use only. It may not be sold, licensed, or shared on other websites without obtaining consent from the author.
E N D
Presentation Transcript
Stakeholder Engagement Students with Disabilities under IDEA B Indicator 1-Graduation Indicator 2-Drop out Indicator 14-Post-School Outcomes Investing for tomorrow, delivering today.
Housekeeping Meeting Norms Everyone has valuable information to provide Raise your hand via Zoom Liz Schweiger will acknowledge those with raised hands Lower hand 2 Investing for tomorrow, delivering today.
Housekeeping Meeting Norms Parents/Guardians will have the option to provide input first Chat box available for questions Moderated by Leah Johnson Jamboard available for feedback Moderated by Matthew Kump 3 Investing for tomorrow, delivering today.
Jamboard Matthew Kump
Individuals with Disabilities Education Act Part B A student that 1.Has a disability and 2.The need for specialized instruction Disability Categories: - Intellectual Disability - Hearing Impairment - Speech or Language Impairment - Visual Impairment - Emotional Disturbance - Orthopedic Impairment - Autism - Traumatic Brain Injury - Other Heath Impairment - Specific Learning Disability - Deaf-Blindness - Multiple Disabilities Gifted Services are a New Mexico rule and gifted students are not counted in any of the data reported to the Office of Special Education Programs (OSEP) 5 Investing for tomorrow, delivering today.
Overview of the State Performance Plan (SPP)/ Annual Performance Report (APR) States receiving funds from the U.S. Department of Education, to implement the Individuals with Disabilities Education Act (IDEA) must develop a State Performance Plan (SPP) The SPP describes State efforts to meet the requirements and purposes of IDEA, Part B States must report on the performance of the SPP through the Annual Performance Report (APR) Completing the SPP and APR relies on the collection and use of a variety of data 6 Investing for tomorrow, delivering today.
IDEA B Indicators Reporting in the SPP/APR 2 Types of Indicators Compliance and Target Indicators Indicators up to FFY2019: Compliance Indicators Target Indicators Indicator 4B Suspension/Expulsion Indicator 8 Parent Involvement Indicator 1 Graduation Indicator 9 Disproportionate Representation Indicator 2 Drop out Indicator 14 Post-School Outcomes Indicator 10 Disproportionate Representation Indicator 3B & 3C Assessment Participation & Outcomes Indicator 15 Resolution Sessions Indicator 11 Child Find/60 Day Timeline Indicator 4A Suspension/Expulsion Indicator 16 Mediation Indicator 12 Part C to B Transition Indicator 5 Education Environments Indicator 13 Secondary Transition Indicator 6 Preschool Education Environments Indicator 7 Preschool Outcomes 7 Investing for tomorrow, delivering today.
IDEA B Indicators Changes in the SPP/APR Indicators for FFY2020 to FFY 2025: 8 Investing for tomorrow, delivering today.
Indicator Information for Indicator 2 Current reporting requirements FFY 2019 Sampling is not allowed. 2. Percent of youth with IEPs dropping out of high school. (20 U.S.C. 1416 (a)(3)(A)) OPTION 1: OPTION 1: Data Source: Same data as used for reporting to the Department under section 618 of the Individuals with Disabilities Education Act (IDEA), using the definitions in EDFacts file specification C009. Use 618 exiting data for the year before the reporting year (e.g., for the FFY 2018 SPP/APR, use data from 2017-2018). Include in the denominator the following exiting categories: (a) graduated with a regular high school diploma; (b) received a certificate; (c) reached maximum age; (d) dropped out; or (e) died. Do not include in the denominator the number of youths with IEPs who exited special education due to: (a) transferring to regular education; or (b) who moved, but are known to be continuing in an educational program. Measurement: OPTION 2: States must report a percentage using the number of youth with IEPs (ages 14-21) who exited special education due to dropping out in the numerator and the number of all youth with IEPs who left high school (ages 14-21) in the denominator. Use the annual event school dropout rate for students leaving a school in a single year determined in accordance with the National Center for Education Statistic's Common Core of Data. OPTION 2: If the State has made or proposes to make changes to the data source or measurement under Option 2, when compared to the information reported in its FFY 2010 SPP/APR submitted on February 1, 2012, the State should include a justification as to why such changes are warranted. Use same data source and measurement that the State used to report in its FFY 2010 SPP/APR that was submitted on February 1, 2012. Options 1 and 2: Data for this indicator are lag data. Describe the results of the State s examination of the data for the year before the reporting year (e.g., for the FFY 2018 SPP/APR, use data from 2017-2018), and compare the results to the target. Provide a narrative that describes what counts as dropping out for all youth and, if different, what counts as dropping out for youth with IEPs. If there is a difference, explain. 9 Investing for tomorrow, delivering today.
Indicator 2 Drop Out Data: Number of youth with IEPs who exited special education due to dropping out 626 Total number of High School Students with IEPs by Cohort 2,632 Option 1 used Lag year data used 10 Investing for tomorrow, delivering today.
Indicator Information for Indicator 2 No change for FFY 2020-2025 if use Option 1. 2. Percent of youth with IEPs dropping out of high school. Same data as used for reporting to the Department under section 618 of the Individuals with Disabilities Education Act (IDEA), using the definitions in EDFacts file specification FS009. Option 1: Sampling is not allowed. Data Source: Data for this indicator are lag data. Describe the results of the State s examination of the data for the year before the reporting year (e.g., for the FFY 2020 SPP/APR, use data from 2019-2020), and compare the results to the target. Provide the actual numbers used in the calculation. (20 U.S.C. 1416 (a)(3)(A)) With the FFY 2020 SPP/APR, due February 1, 2022, States may use either option 1 or 2. OPTION 1: Measurement: Use 618 exiting data for the year before the reporting year (e.g., for the FFY 2020 SPP/APR, use data from 2019-2020). Include in the denominator the following exiting categories: (a) graduated with a regular high school diploma; (b) graduated with a state-defined alternate diploma; (c) received a certificate; (d) reached maximum age; (e) dropped out; or (f) died. States must report a percentage using the number of youth with IEPs (ages 14-21) who exited special education due to dropping out in the numerator and the number of all youth with IEPs who left high school (ages 14-21) in the denominator. OPTION 2 (For FFY 2020 ONLY): Do not include in the denominator the number of youths with IEPs who exited special education due to: (a) transferring to regular education; or (b) who moved but are known to be continuing in an educational program. Use same data source and measurement that the State used to report in its FFY 2010 SPP/APR that was submitted on February 1, 2012. OPTION 2: Use the annual event school dropout rate for students leaving a school in a single year determined in accordance with the National Center for Education Statistic's Common Core of Data. If the State has made or proposes to make changes to the data source or measurement under Option 2, when compared to the information reported in its FFY 2010 SPP/APR submitted on February 1, 2012, the State should include a justification as to why such changes are warranted. Options 1 and 2: Provide a narrative that describes what counts as dropping out for all youth. Please explain if there is a difference between what counts as dropping out for all students and what counts as dropping out for students with IEPs. Beginning with the FFY 2021 SPP/APR, due February 1, 2023, States must report data using the same data as used for reporting to the Department under section 618 of the IDEA. 11 Investing for tomorrow, delivering today.
Indicator 2 Measurement Option 1: (a) graduated with a regular high school diploma; (b) graduated with a state-defined alternate diploma; (c) received a certificate; (d) reached maximum age; (e) dropped out; or (f) died. All youth with IEPs who left high school (ages 14-21) 12 Investing for tomorrow, delivering today.
Indicator 2 Targets and Baselines Each Target Indicator requires Baselines: Starting point. Indicator 2 Baseline Year 2013 Baseline 24.75% Targets: The rate FFY 2014 2015 2016 2017 2018 2019 23.72% 23.22% 22.97% 22.97% 22.97% 22.97% Target 13 Investing for tomorrow, delivering today.
Indicator 2 Drop Out Results indicator: Percent of youth with IEPs dropping out of high school. (20 U.S.C. 1416 (a)(3)(A)) Data: Number of youth with IEPs who exited special education due to dropping out Total number of High School Students with IEPs by Cohort FFY 2018 Data FFY 2019 Target FFY 2019 Data Status Slippage No Slippage Did Not Meet Target 626 2,632 25.79% 22.97% 23.78% Lag year data used 14 Investing for tomorrow, delivering today.
Indicator 2 Drop out Targets Last 6 Years of Targets and Data FFY 2014 2015 2016 2017 2018 2019 23.72% 23.22% 22.97% 22.97% 22.97% 22.97% Target 23.73% 26.30% 26.94% 22.84% 25.79% 23.78% Data Target Not Met Target Not Met Target Not Met Target Met Target Not Met Target Not Met 15 Investing for tomorrow, delivering today.
Indicator 2 Drop out 4 Years of Data Drop Out 28.00% 27.00% 26.00% 25.00% 24.00% 23.00% 22.00% 21.00% 20.00% 2016 2017 2018 2019 Data Target 16 Investing for tomorrow, delivering today.
Indicator 2 Drop out Rate of Growth (Loss) and Difference between Target and State Rate Rate of Growth/Loss Between Years Difference Between Target and State Data FFY 2014 to FFY 2015: 2.57% FFY 2014: 0.01% FFY 2015 to FFY 2016: 0.64% FFY 2015: 3.08% FFY 2016 to FFY 2017: 4.10% FFY 2016: 3.97% FFY 2017 to FFY 2018: 2.95% FFY 2017: 0.13% FFY 2018 to FFY 2019: 2.01% FFY 2018: 2.82% FFY 2019: 0.81% Average Rate of Growth: 0.05% 17 Investing for tomorrow, delivering today.
Indicator 2 Measurement Option 1: (a) graduated with a regular high school diploma = (d) reached maximum age = (e) dropped out = (f) died = All youth with IEPs who left high school (ages 14-21) 18 Investing for tomorrow, delivering today.
Indicator 2 Drop out Analyzing Data Stakeholder Input
Indicator 2 Drop out Target Setting Stakeholder Input
Indicator 2 Drop out Evaluating Progress Stakeholder Input
Indicator 2 Drop out Improvement Strategies Stakeholder Input
Indicator Information for Indicator 1 Current reporting requirements FFY 2019 Monitoring Priorities and Indicators Monitoring Priority: FAPE in the LRE 1. Percent of youth with Individualized Education Programs (IEPs) graduating from high school with a regular high school diploma. Department of Education (Department) under Title I of the Elementary and Secondary Education Act (ESEA). Data Source and Measurement Instructions for Indicators/Measurement Sampling is not allowed. Data Source: Same data as used for reporting to the Describe the results of the State s examination of the data for the year before the reporting year (e.g., for the FFY 2018 SPP/APR, use data from 2017-2018), and compare the results to the target. Provide the actual numbers used in the calculation. (20 U.S.C. 1416 (a)(3)(A)) Provide a narrative that describes the conditions youth must meet in order to graduate with a regular high school diploma and, if different, the conditions that youth with IEPs must meet in order to graduate with a regular high school diploma. If there is a difference, explain. Measurement: States may report data for children with disabilities using either the four-year adjusted cohort graduation rate required under the ESEA or an extended-year adjusted cohort graduation rate under the ESEA, if the State has established one. Targets should be the same as the annual graduation rate targets for children with disabilities under Title I of the ESEA. States must continue to report the four-year adjusted cohort graduation rate for all students and disaggregated by student subgroups including the children with disabilities subgroup, as required under section 1111(h)(1)(C)(iii)(II) of the ESEA, on State report cards under Title I of the ESEA even if they only report an extended-year adjusted cohort graduation rate for the purpose of SPP/APR reporting. 23 Investing for tomorrow, delivering today.
Indicator 1 - Graduation Data in SPP/APR: Number of youth with IEPs in the current year s adjusted cohort graduating with a regular diploma 2,424 Number of youth with IEPs in the current year s adjusted cohort eligible to graduate 3,749 4-Year Adjusted Cohort Rate used Lag year data used 24 Investing for tomorrow, delivering today.
Indicator Information for Indicators 1 Changes Monitoring Priorities and Indicators Data Source and Measurement Instructions for Indicators/Measurement Data Source: Same data as used for reporting to the Department under section 618 of the Individuals with Disabilities Education Act (IDEA), using the definitions in EDFacts file specification FS009. 1. Percent of youth with Individualized Education Programs (IEPs) exiting from high school with a regular high school diploma. Sampling is not allowed. Data for this indicator are lag data. Describe the results of the State s examination of the data for the year before the reporting year (e.g., for the FFY 2020 SPP/APR, use data from 2019-2020), and compare the results to the target. Provide the actual numbers used in the calculation. (20 U.S.C. 1416 (a)(3)(A)) Include in the denominator the following exiting categories: (a) graduated with a regular high school diploma; (b) graduated with a state-defined alternate diploma; (c) received a certificate; (d) reached maximum age; or (e) dropped out. Measurement: States must report a percentage using the number of youth with IEPs (ages 14-21) who exited special education due to graduating with a regular high school diploma in the numerator and the number of all youth with IEPs who left high school (ages 14-21) in the denominator. Do not include in the denominator the number of youths with IEPs who exited special education due to: (a) transferring to regular education; or (b) who moved but are known to be continuing in an educational program. Provide a narrative that describes the conditions youth must meet in order to graduate with a regular high school diploma. If the conditions that youth with IEPs must meet in order to graduate with a regular high school diploma are different, please explain. 25 Investing for tomorrow, delivering today.
New Measurement for Indicator 1 New Measurement: Youth with IEPs that (a) graduated with a regular high school diploma; (b) graduated with a state-defined alternate diploma; (c) received a certificate; (d) reached maximum age; or (e) dropped out. All youth with IEPs who left high school (ages 14-21) 26 Investing for tomorrow, delivering today.
Indicator 1 Targets and Baselines Each Target Indicator requires Baselines: Starting point. Indicator 1 Baseline Year 2011 Baseline 50.50% Targets: The rate FFY 2014 2015 2016 2017 2018 2019 73.70% 75.60% 77.40% 77.40% 77.40% Targets 77.40% 27 Investing for tomorrow, delivering today.
Indicator 1 Graduation Data FFY 2019 Data: Number of youth with IEPs in the current year s adjusted cohort graduating with a regular diploma Number of youth with IEPs in the current year s adjusted cohort eligible to graduate FFY 2018 Data FFY 2019 Target FFY 2019 Data Status Slippage Did Not Meet Target 2,424 3,749 65.60% 77.40% 64.66% No Slippage 4-Year Adjusted Cohort Rate used Lag year data used 28 Investing for tomorrow, delivering today.
Indicator 1 - Graduation Targets Last 6 Years of Targets and Data FFY 2014 2015 2016 2017 2018 2019 73.70% 75.60% 77.40% 77.40% 77.40% Target 77.40% 64.66% 56.49% 59.32% 61.85% 61.54% 65.60% Data Target Not Met Target Not Met Target Not Met Target Not Met Target Not Met Target Not Met 29 Investing for tomorrow, delivering today.
Indicator 1 Graduation 4 Years of Data Graduation Rates 90.00% 80.00% 77.40% 77.40% 77.40% 77.40% 70.00% 65.60% 64.66% 61.85% 61.54% 60.00% 50.00% 40.00% 30.00% 20.00% 10.00% 0.00% 2016 2017 2018 2019 Data Target 30 Investing for tomorrow, delivering today.
Indicator 1 Graduation Rate of Growth (Loss) and Difference between Target and State Rate Rate of Growth/Loss Between Years Difference Between Target and State Data FFY 2014 to FFY 2015: 2.83% FFY 2014: 17.21% FFY 2015 to FFY 2016: 2.53% FFY 2015: 16.28% FFY 2016 to FFY 2017: -0.31% FFY 2016: 15.55% FFY 2017 to FFY 2018: 4.06% FFY 2017: 15.86% FFY 2018 to FFY 2019: -0.94% FFY 2018: 11.80% FFY 2019: 12.74% Average Rate of Growth: 1.634% 31 Investing for tomorrow, delivering today.
New Measurement for Indicator 1 Youth with IEPs that: (a) graduated with a regular high school diploma = (d) reached maximum age; or = (e) dropped out = All youth with IEPs who left high school (ages 14-21) = 32 Investing for tomorrow, delivering today.
Indicator 1 Graduation Analyzing Data Stakeholder Input
Indicator 1 Graduation Target Setting Stakeholder Input
Indicator 1 Graduation Evaluating Progress Stakeholder Input
Indicator 1 Graduation Improvement Strategies Stakeholder Input
Indicator Information for Indicator 14 Current reporting requirements FFY 2019 No changes in measurement 14. are no longer in secondary school, had IEPs in effect at the time they left school, and were: A. Enrolled in higher education within one year of leaving high school. B. Enrolled in higher education or competitively employed within one year of leaving high school. C. Enrolled in higher education or in some other postsecondary education or training program; or competitively employed or in some other employment within one year of leaving high school. (20 U.S.C. 1416(a)(3)(B)) Percent of youth who Data Source: State selected data source. Measurement: A. Percent enrolled in higher education = [(# of youth who are no longer in secondary school, had IEPs in effect at the time they left school and were enrolled in higher education within one year of leaving high school) divided by the (# of respondent youth who are no longer in secondary school and had IEPs in effect at the time they left school)] times 100. Option 2: States report in alignment with the term competitive integrated employment and its definition, in section 7(5) of the Rehabilitation Act, as amended by Workforce Innovation and Opportunity Act (WIOA), and 34 CFR 361.5(c)(9). For the purpose of defining the rate of compensation for students working on a part-time basis under this category, OSEP maintains the standard of 20 hours a week for at least 90 days at any time in the year since leaving high school. This definition applies to military employment. When reporting in the FFY 2019 SPP/APR, due February 2021, all States must use Option 2. Enrolled in other postsecondary education or training as used in measure C, means youth have been enrolled on a full- or part- time basis for at least 1 complete term at any time in the year since leaving high school in an education or training program (e.g., Job Corps, adult education, workforce development program, vocational technical school which is less than a two year program). 37 Investing for tomorrow, delivering today.
Indicator Information for Indicator 14 Some other employment as used in measure C means youth have worked for pay or been self-employed for a period of at least 90 days at any time in the year since leaving high school. This includes working in a family business (e.g., farm, store, fishing, ranching, catering services, etc.). II. Data Reporting Provide the actual numbers for each of the following mutually exclusive categories. The actual number of leavers who are: 1. Enrolled in higher education within one year of leaving high school; 2. Competitively employed within one year of leaving high school (but not enrolled in higher education); 3. Enrolled in some other postsecondary education or training program within one year of leaving high school (but not enrolled in higher education or competitively employed); 4. In some other employment within one year of leaving high school (but not enrolled in higher education, some other postsecondary education or training program, or competitively employed). 38 Investing for tomorrow, delivering today.
Indicator Information for Indicator 14 Leavers should only be counted in one of the above categories, and the categories are organized hierarchically. So, for example, leavers who are enrolled in full- or part-time higher education within one year of leaving high school should only be reported in category 1, even if they also happen to be employed. Likewise, leavers who are not enrolled in either part- or full-time higher education, but who are competitively employed, should only be reported under category 2, even if they happen to be enrolled in some other postsecondary education or training program. III. Reporting On the Measures/Indicators Targets must be established for measures A, B, and C. Measure A: For purposes of reporting on the 39 Investing for tomorrow, delivering today.
Indicator 14: Post-Secondary Outcomes Changes Two choices remain for definition of competitive employment State must provide total number of targeted youth in the sample or census Response rate State must compare the response rate for the reporting year to the response rate for the previous year Describe strategies that the state will implement that are expected to increase the response rate, particularly for those groups that are underrepresented The state also must analyze the response rate to identify potential nonresponse bias and take steps to reduce any identified bias and promote response from a broad cross section of youth who are no longer in secondary school and had IEPs in effect at the time they left school 40 Investing for tomorrow, delivering today.
Indicator 14: Post-Secondary Outcomes Changes Beginning with the FFY 2021 SPP/APR, due Feb. 1, 2023, when reporting the extent to which the demographics of respondents are representative of the demographics of youth who are no longer in secondary school and had IEPs in effect at the time they left school State must include race and ethnicity in its analysis In addition, the State s analysis must include at least one of the following demographics: disability category, gender, geographic location, and/or another demographic category approved through the stakeholder input process 41 Investing for tomorrow, delivering today.
Indicator 14 Baselines Each Target Indicator requires: Baselines: Starting point. Indicator 14A 14B 14C Baseline Year 2009 2009 2009 Baseline 48.00% 75.00% 79.00% 42 Investing for tomorrow, delivering today.
Indicator 14 Targets Each Target Indicator requires Targets: The rate Measure Baseline FFY 2014 2015 2016 2017 2018 2019 2009 Target 49.00% 49.00% 49.00% 49.00% 49.00% 49.00% A 48.00% Data 43.26% 42.85% 41.13% 40.01% 36.80% 35.61% A 2009 Target 76.00% 76.00% 76.00% 76.00% 76.00% 76.00% B 75.00% Data 76.10% 75.34% 76.39% 75.47% 73.08% 74.81% B 2009 Target 80.00% 80.00% 80.00% 80.00% 76.00% 76.00% C 79.00% Data 80.71% 81.37% 80.94% 82.82% 77.76% 79.42% C 43 Investing for tomorrow, delivering today.
Indicator 14: Post-School Outcomes Data: Number of respondent youth who are no longer in secondary school and had IEPs in effect at the time they left school Number of respondent youth FFY 2019 Target FFY 2019 Data Measure FFY 2018 Data Status Slippage A. Enrolled in higher education (1) B. Enrolled in higher education or competitively employed within one year of leaving high school (1 +2) C. Enrolled in higher education, or in some other postsecondary education or training program; or competitively employed or in some other employment (1+2+3+4) Did Not Meet Target 564 1,584 36.80% 49.00% 35.61% Slippage Did Not Meet Target 1,185 1,584 73.08% 76.00% 74.81% No Slippage Did Not Meet Target 1,258 1,584 77.76% 80.00% 79.42% No Slippage 44 Investing for tomorrow, delivering today.
Indicator 14 Targets Last 6 years of Targets and Data Measure FFY 2014 2015 2016 2017 2018 2019 Target 49.00% 49.00% 49.00% 49.00% 49.00% 49.00% A Data 43.26% 42.85% 41.13% 40.01% 36.80% 35.61% A Target Not Met Target Not Met Target Not Met Target Not Met Target Not Met Target Not Met Target 76.00% 76.00% 76.00% 76.00% 76.00% 76.00% B Data 76.10% 75.34% 76.39% 75.47% 73.08% 74.81% B Target Met Target Not Met Target Met Target Not Met Target Not Met Target Not Met Target 80.00% 80.00% 80.00% 80.00% 76.00% 76.00% C Data 80.71% 81.37% 80.94% 82.82% 77.76% 79.42% C Target Met Target Met Target Met Target Met Target Met Target Met 45 Investing for tomorrow, delivering today.
Demographic Data Glenn Damian, NEREC #4 46 Investing for tomorrow, delivering today.
Indicator 14 Post-School Outcomes Analyzing Data Stakeholder Input
Indicator 14 Post-School Outcomes Target Setting Stakeholder Input
Indicator 14 Post-School Outcomes Evaluating Progress Stakeholder Input
Indicator 1 Post-School Outcomes Improvement Strategies Stakeholder Input


/")


")


")