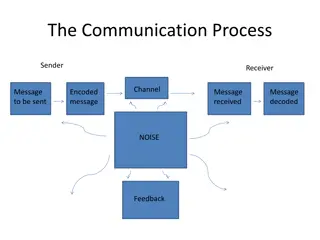
Stakeholders Communication Channels and QC Testing Plan
This content discusses stakeholders involved in a project, their communication channels, and a detailed plan for automated QC testing. Stakeholders range from US Taxpayers to Government Agencies and Influencers. Communication channels vary from Press Releases to Biannual Meetings. The QC testing plan includes implementing community QARTOD code and designing a data structure to store test results effectively.

Download Presentation

Please find below an Image/Link to download the presentation.
The content on the website is provided AS IS for your information and personal use only. It may not be sold, licensed, or shared on other websites without obtaining consent from the author.If you encounter any issues during the download, it is possible that the publisher has removed the file from their server.
You are allowed to download the files provided on this website for personal or commercial use, subject to the condition that they are used lawfully. All files are the property of their respective owners.
The content on the website is provided AS IS for your information and personal use only. It may not be sold, licensed, or shared on other websites without obtaining consent from the author.
E N D
Presentation Transcript
Homework October 23, 2019
Question 1: Who are the stakeholders? Stakeholder Type US Taxpayers Category Users Communication Channel(s) Press Releases How to Get Feedback N/A Cooperative Agreement Deliverables and weekly meetings. Weekly and Ad hoc Meetings, Phone, Email NSF Sponsor Governance NSF Guidance (OOIFB, Review Panels, etc.) Influencers Biannual Meetings Reports, Emails Weekly and ad hoc meetings, CCB, email. Internal Oversight Meetings OOI Team OOI MIO Universities Oceanographic Community Keep Informed OOI Science Users, defined as any Scientist that may use OOI Data as part of their research. Educators K-12 Educators- Higher Ed Key Players Keep Informed Weekly and ad hoc meetings, CCB, email. Presentations, emails, phone Influencers Influencers Influencers Conferences, Webinars, Social Media, Website, Emails, Seminars, Phone, Help Desk Governmant Agencies (NOAA, ONR, DOE, USGS) Military Branches Fisherman (OFCC, CFRF) Influencers Influencers Influencers 2
Question 2: PYII Plan for automated QC testing for QARTOD Complete Gross Range implementation of community QARTOD code Architect and build QC server Automatically runs in background Detects new data and applies required QC testing as determined by set-up tables Has run-time parameters to allow targeting of full data set, one instrument or a time period for re-testing for specific QARTOD test Design and build data structure to store QARTOD test results Use string to store results Architect to store 15+ test results per row for fast growing large data set of rows Use staging table to temporarily hold results Transfer staging table results to netcdf file structure for persistent storage Modify QC server to use data structure 3
4 Question 2: PYII QA/QC Approach Ongoing Phase 2 Phase 3 Phase 1 Priority Automated Development Manual QA/QC Core Physical Samples+ Discrete Samples QA/QC data generated by provider of analytical results Repository & Communication plan required QARTOD applicable instruments Instruments w/ SME testing recommendation Remainder of Instrumentation QA/QC Focus SAF contains original SME recommended algorithms that could be applied, develop test protocols Apply QARTOD standards to OOI instrumentation As Priority 1 tests are generated, Priority 2 & 3 instrument lists will naturally form OOI would engage SMEs specific to remainder of instrumentation, develop test protocols % of 59% (27 of 46) 41% (19 of 46) Instrument Classes Seismic, CAMDS, CAMHD PCO2W, BOTPT OSMOI, FLOBNC, PPS Example Instrument(s) CTDBP
Question 3: Plan for Redesign of oceanobs..org Client/Agency pre-planning sessions complete Community Feedback Survey Complete 31 Oct: Trapeze to submit final site map for OOI approval 3-6 Dec: Finalize design for all pages/social media 10 Dec 24 Jan: Development and build/content upload 27 Jan: Trapeze to present development site 31 Jan: OOI feedback and revisions 3-14 Feb: Website production/site testing/QA 19 Feb: OOI final review of website 21 Feb: OOI approval to launch 24 Feb: Website launches Ocean Outlook 2019 5
Question 3: PYII UX Data Portal Redesign Plan Proof of Concept UI based upon static data set - 12/1/19 Gives Axiom experience working with OOI data Helps determine technical path to utilize previous Axiom visualization code Starting point to have discussions with MIOs and users Document and discuss project structure, communication plans and agenda for MIO site visit - TBD in November MIO on-site interview First few weeks in December Gather/review requirements from both a historical point of view and lessons learned Interview users Build User Panel Start contacting in November Collate requirements, feedback and discussion notes into project document with plan 2/1/19 Milestones Deliver Proof of Concept Engage user community Operationalize a custom user interface including data discovery, visualization and integration tools Implement data harvesting and standardization for ingested OOI assets Deploy machine to machine interface for OOI data assets Formalize policies and implement systems for data curation and archive 6
Question 4: Histogram for elapsed time to data delivery What impacts the time it takes to deliver data On-demand building of data On-demand QC testing Provenance look-up Number of data points being calculated Complexity of instrument requested (e.g. ADCP) Plan to deliver a histogram of time to data delivery 1/15/19 Adjust data model to create stand alone History table Add required keys to History table Build view to optimize table use Adjust web service to use new view Demo of what we can report today 7
Question 5: What does success look like? Success means that we can demonstrate: OOI assets and sampling are optimized to answer the most important scientific questions. OOI platforms and sensors perform at high levels of success. OOI data quality and delivery are consistent with QARTOD and FAIR principles and standards. Large numbers of scientists from large numbers institutions are funded to use OOI data and infrastructure to write many highly cited papers. OOI data are used in courses by many teachers across many disciplines at many institutions reaching many students. The OOI user community is large, diverse, and engaged in a wide range of activities. 9
Success: Data Delivery Sustained, high functioning infrastructure (~80-100% operational each year) and flow of high quality data that allows users to address the key questions laid out in the foundational Science Plan and documented through the traceability matrix s (end to end paths). Measurable performant data delivery where: Time to delivery is known and predictable Data and system metrics allow for planning future hardware investments System transparency where status of data is automatically monitored at all touch points with escalation of issues Data quality that is known and measurable for reporting to both program and users High quality, easily accessible and explorable data. The portal continues to evolve in response to community needs. Evidence includes detailed documentation with respect to metadata and evaluation status, users that continue to return to the portal and utilize the data, positive user feedback. 10
Success: Community Engagement That there is a robust, engaged diverse community including a strong presence of early career users that utilize data, engage students, and advance technology. Measured outcomes include: A strong attendance at meetings and proposed meetings/ workshops by those out side of the OOI organization (e.g Ocean Hackweek); the MIOs become facilitators but do not drive these meetings. Sustained, and increasing significant proposal pressure to NSF education, technology, cyberinfrasctructure, science (#/s of proposals from a diverse community); continued growth in awards by other institutions/organizations (ONR, NASA, International, foundations). Strong growth in publications and abstracts. 11
Defining Success CI Hardware Provide a secure, reliable and performant Cyberinfrastructure that can support the current and future needs of the OOI user community. System availability all nines 99.999% No security breaches Scalable system to accommodate future loads and response times Future success goals: Implementation of a Tech refresh plan that leverages state of the art solutions and technologies Provide a robust and tested DR redundancy solution Transition completed on schedule - September 30, 2019 12
Question 6: Whats The Plan to Expand the OOI User Base? a) Participation in National Meetings. b) Community Webinars. c) Regional Stakeholder Outreach. d) Regional Science and Technology Outreach. e) Maintenance and Refreshment of the OOI Website. f) Short Courses g) Workshops h) OOI Engagement Manager Activities Establish User Database, current and new Presentations/Seminars at Oceanographic Organizations Develop and Implement Social Media Strategy Press Releases 13