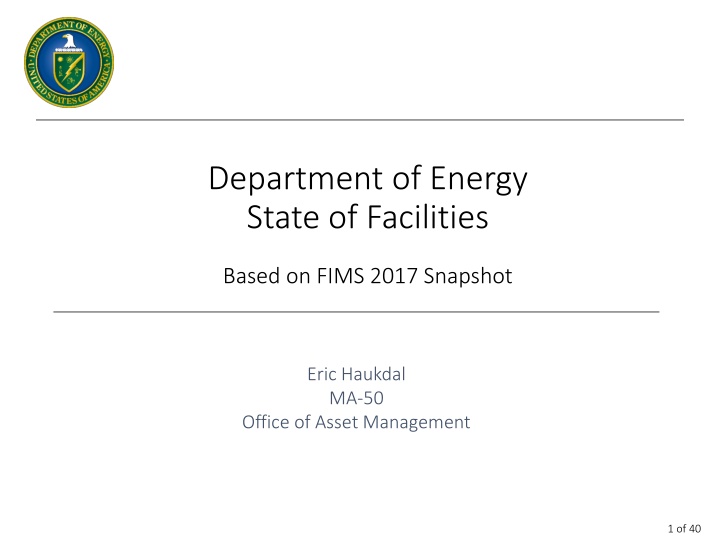
State of Facilities Based on FIMS 2017 Snapshot by Eric Haukdal
This content discusses the state of facilities based on the FIMS 2017 snapshot by Eric Haukdal. It provides insights into the Department of Energy's Office of Asset Management. The information presented highlights the current state of facilities in a detailed manner, offering valuable data for analysis and decision-making processes.

Download Presentation

Please find below an Image/Link to download the presentation.
The content on the website is provided AS IS for your information and personal use only. It may not be sold, licensed, or shared on other websites without obtaining consent from the author.If you encounter any issues during the download, it is possible that the publisher has removed the file from their server.
You are allowed to download the files provided on this website for personal or commercial use, subject to the condition that they are used lawfully. All files are the property of their respective owners.
The content on the website is provided AS IS for your information and personal use only. It may not be sold, licensed, or shared on other websites without obtaining consent from the author.
E N D
Presentation Transcript
Department of Energy State of Facilities Based on FIMS 2017 Snapshot Eric Haukdal MA-50 Office of Asset Management 1 of 40
Overview This discussion highlights the Department s status in regards to the following performance areas: 1. Inventory DOE s real property holdings 6. Disposition The degree to which DOE identifies and disposes of excess property 2. Alignment The degree to which real property assets are linked to core capabilities and mission requirements 7. Management How well DOE invests in and maintains real property in a sustainable and cost effective manner 3. Condition Level of repair of real property assets 8. Data Reliability Completeness and accuracy of real property data used to support and inform real property asset decisions 4. Functionality Adequacy of real property assets to support operations 5. Utilization The degree to which DOE activities are using existing space 2 of 40
1 - Inventory Overview Measure: Inventory Purpose: To provide info about the Department s real property holdings and to serve as a normalizing factor for additional measures Calculations: Buildings & Trailers: Total Size of Assets (in Square Feet) OSFs: Total RPV of Assets Land: Total Size of Assets (in Acres) 3 of 40
1 - Inventory Active/Inactive Buildings & Trailers GSF of Active/Inactive Buildings & Trailers Almost 12% of all buildings and trailers are currently inactive (by square footage) Some notable annual changes include: - 2015: 7.6M ft2 Paducah site transferred from an inactive NE site to an active EM clean-up site - 2016: 3M ft2at NNSA s Kansas City Security Campus moved from blank Status (presumed active) to Undergoing Stabilization (inactive) and - 2016: 8M ft2 at EM s Portsmouth Gaseous facility moved from blank to Undergoing Stabilization - 2017: 5.6M ft2at EM s Portsmouth Gaseous facility reclassified from Undergoing Stabilization to Standby For Both "Active" & "Inactive" Data: Sum of Size Fiscal Year = applicable FY Property Type = Building or Trailer For "Active" Data: Status = Operating, Outgranted, Standby, or (Blank) For "Inactive" Data: Status Operating, Outgranted, Standby, and (Blank) 4 of 40
1 - Inventory Active/Inactive OSFs RPV of Active/Inactive OSFs Compared to Buildings and Trailers, there are much fewer inactive OSFs (less than 7% of overall OSF portfolio by RPV) Steady increase is primarily a result of inflation since sites update RPV s on a regular basis For Both "Active" & "Inactive" Data: Sum of RPV Fiscal Year = applicable FY Property Type = OSF For "Active" Data: Status = Operating, Outgranted, Standby, or (Blank) For "Inactive" Data: Status Operating, Outgranted, Standby, and (Blank) 5 of 40
1 - Inventory Active/Inactive Land Acres of Active/Inactive Land Less than 3% of land assets (by acreage) are inactive Slight but steady decrease in acres of land over the past five years For Both "Active" & "Inactive" Data: Sum of Size Fiscal Year = applicable FY Property Type = Land For "Active" Data: Status = Active Land or (Blank) For "Inactive" Data: Status Active Land and (Blank) 6 of 40
1 - Inventory Owned/Not-Owned Buildings & Trailers Amount of owned square footage steady over the past five years Noticeable increase in non- owned buildings & trailers in 2014 but mostly due to adding square footage data to existing assets: - MA added 2.3M ft2 by populating the FIMS database with GSF data for existing properties - NNSA added about 2.1M ft2 but almost all was a result of updating GSF data for existing facilities - EM added about 811K ft2 of which about 682K ft2 was from updating GSF data for existing facilities. Increase in non-owned buildings & trailers in 2017 due to: - EM added a 1M SqFt Main Plant Process Building at its West Valley Demonstration Project Site - Ownership classified as non- Federal Permit GSF of Owned/Not-Owned Buildings & Trailers For Both "Owned" & "Not-Owned" Data: Sum of Size Fiscal Year = applicable FY Property Type = Building or Trailer For "Owned" Data: Ownership = DOE Owned (O) or (Blank) For "Not Owned" Data: Ownership DOE Owned (O) and (Blank) 7 of 40
1 - Inventory Owned/Not-Owned OSFs RPV of Owned/Not-Owned OSFs Almost all OSFs are owned by the DOE (over 99.9%) Steady increase is primarily a result of inflation since sites update RPV s on a regular basis For Both "Owned" & "Not-Owned" Data: Sum of RPV Fiscal Year = applicable FY Property Type = OSF For "Owned" Data: Ownership = DOE Owned (O) or (Blank) For "Not Owned" Data: Ownership DOE Owned (O) and (Blank) 8 of 40
1 - Inventory Owned/Not-Owned Land Acres of Owned/Not-Owned Land A large portion of DOE s land is not owned by DOE but, rather, withdrawn from the public domain Over 90% of that withdrawn land is associated with just two sites: - NNSA s National Nevada Security Site (866K acres of withdrawn land) - NE s Idaho National Lab Scoville site (505K acres withdrawn land) For Both "Owned" & "Not-Owned" Data: Sum of Size Fiscal Year = applicable FY Property Type = Land For "Owned" Data: Ownership = DOE Owned (O) or (Blank) For "Withdrawn" Data: Ownership = Withdrawn Land (W) For "Not Owned" Data: Ownership DOE Owned (O), Withdrawn Land (W), and (Blank) 9 of 40
2 - Alignment Overview Measure: Alignment Index Purpose: To show the degree to which real property assets are linked to core capabilities and mission requirements Calculations: Size (SqFt) of Assets with Core Capability # 1 Identified Buildings & Trailers: X 100 Total Size (SqFt) RPV of Assets with Core Capability # 1 Identified OSFs: X 100 Total RPV Size (Acres) of Assets with Core Capability # 1 Identified Land: X 100 Total Size (Acres) 10 of 40
2 Alignment Alignment Index Size (SqFt) of Assets with Core Capability # 1 Identified X 100 Total Size (SqFt) Alignment Index Active Buildings & Trailers Metric only applies to Active assets since in-active assets would not be expected to fulfill a mission need Core Capability established by the LOB as an optional field in 2013 New 430.1C (section 4a(1)(f)) established this as a required field as of Aug 2016 For Both "SF of Core Capability ID'd" & "Total SF" Data: Sum of Size Fiscal Year = applicable FY's Property Type = Building or Trailer Status = Operating, Standby, Outgranted, or (Blank) For "SF of Core Capability ID'd" Data: Core Capability - 1 (Blank) 11 of 40
2 Alignment Alignment Index Alignment Index Operating OSFs Alignment Index Active Land For "RPV of Core Capability ID'd Column" & "Total RPV": Sum of RPV Fiscal Year = applicable FY's Property Type = OSF Status = Operating, Standby, Outgranted, or (Blank) For "RPV of Core Capability ID'd" Data: Core Capability - 1 (Blank) For "Acreage of Core Capability ID'd" & "Total Acreage" Data: Sum of Size Fiscal Year = applicable FY's Property Type = Land Status = Active Land or (Blank) For "Acreage of Core Capability ID'd" Data: Core Capability - 1 (Blank) 12 of 40
3 - Condition Overview Measure: Condition Index Purpose: To provide insight into the level of repair needed to bring real property assets structures and systems back to their original physical condition or specifications (i.e. back to good working order) Calculation: Applies to Buildings, Trailers, and OSFs: Repair Needs 1 X 100 Total RPV 13 of 40
3 Condition Condition Index Repair Needs 1 X 100 Total RPV Condition Index All Buildings and Trailers Condition Index All OSFs For Both "Repair Needs" & "Total RPV" Data: Fiscal Year = applicable FY's Property Type = Building or Trailer For "Repair" Needs Data: Sum of Repair Needs For "Total RPV" Data: Sum of RPV For Both "Repair Needs" & "Total RPV" Data: Fiscal Year = applicable FY's Property Type = OSF For "Repair" Needs Data: Sum of Repair Needs For "Total RPV" Data: Sum of RPV 14 of 40
3 Condition Condition Index by Program Office Condition Index by Program Office For Both "Repair Needs" & "Total RPV" Data: Fiscal Year = latest snapshot FY Program Office = as applicable For "Repair Needs" Data: Sum of Repair Needs For "Total RPV" Data: Sum of RPV 15 of 40
4 - Functionality Overview Measure: Functionality Index Purpose: To show the degree to which assets are adequately supporting operations Calculations: Size (SqFt) of Assets with Overall Asset Condition = Adequate Buildings & Trailers: X 100 Total Size (SqFt) RPV of Assets with Overall Asset Condition = Adequate OSFs: X 100 Total RPV 16 of 40
4 Functionality Functionality Index Size (SqFt) of Assets with Overall Asset Condition = Adequate X 100 Total Size (SqFt) Functionality Index Active & Assessed B&T First began collecting Overall Asset Condition data in 2014 for DOE Laboratory facilities only Assessment results reported via the Overall Asset Condition FIMS data field The August 2016 update to DOE Order 430.1C (section 4c(10)) requires functional assessments for all assets (not just Labs anymore) Since this is still a new data field, the data set continues to evolve as more sites conduct assessments. Until we reach a more steady state, the year- to-year trends are not likely accurate. For Both "Adequate SF" and "Total SF" Data: Sum of Size Fiscal Year = applicable FY's Property Type = Building or Trailer Status = Operating, (Blank), Outgranted, or Standby For "Adequate SF" Data: Overall Asset Condition = Adequate For "Total SF" Data: Overall Asset Condition = Adequate, Substandard, or Inadequate 17 of 40
4 Functionality Functionality Index RPV of Assets with Overall Asset Condition = Adequate X 100 Total RPV Functionality Index Active & Assessed OSFs For Both "Adequate RPV" and "Total RPV" Data: Sum of RPV Fiscal Year = applicable FY's Property Type = OSF Status = Operating, (Blank), Outgranted, or Standby For "Adequate RPV" Data: Overall Asset Condition = Adequate For "Total RPV" Data: Overall Asset Condition = Adequate, Substandard, or Inadequate 18 of 40
4 Functionality Number of Assets Assessed for Functionality % of Assets Assessed vs. Not Assessed (by RPV) Number Assessed vs. Not Assessed by Program For Both "Total Assessed" and "Total Not Assessed" Data: Sum of RPV Fiscal Year = applicable FY's Property Type = Building, Trailer, or OSF Status = Operating, (Blank), Outgranted, or Standby For "Assessed" Data: Overall Asset Condition = Adequate, Substandard, or Inadequate For "Not Assessed" Data: Overall Asset Condition = (Blank) For "Assessed" and "Not Assessed" Columns: Fiscal Year = Latest Snapshot FY Property Type = Building, Trailer, or OSF Status = Operating, (Blank), Outgranted, or Standby Program Office = applicable PO's For "Assessed" Column: Overall Asset Condition = Adequate, Substandard, or Inadequate For "Not Assessed" Column: Overall Asset Condition = (Blank) 19 of 40
4 Functionality Assessed vs. Not-assessed - EM & PA # of Assessed & Not Assessed for EM & PA For "Assessed" and "Not Assessed" Data: Fiscal Year = applicable FY's Property Type = Building, Trailer, or OSF Status = Operating, (Blank), Outgranted, or Standby Program Office = applicable PO's per chart For "Assessed" Data: Overall Asset Condition = Adequate, Substandard, or Inadequate For "Not Assessed" Data: Overall Asset Condition = (Blank) 20 of 40
5 - Utilization Overview Measures: Portfolio Utilization Index and Office Occupancy Rate Purpose: To show the degree to which the Department is using existing space Calculations: (apply to Buildings & Trailers only) Office Occupancy Rate Portfolio Utilization Index Sum across all assets: Asset % Utilized x Asset Size (SqFt) Util-Office Usable SF X 100 Total No of Occupants Total Portfolio Size (SqFt) or n i=1 (Asset % Utilized) x (Asset Size [SqFt] ) i i X 100 Total Portfolio Size (SqFt) Where 1 to n is the set of all assets in the portfolio 21 of 40
5 Utilization Portfolio Utilization Index Sum across all assets: Util-Asset % Utilized x Asset Size (SqFt) X 100 Total Portfolio Size (SqFt) Portfolio Utilization Index The fluctuations are due more to significant changes in FIMS data quality rather than to changes in actual utilization levels For example, In 2014, MA reported its total square footage for the first time (over 2M Gross ft2) but didn t start reporting its Asset % Utilized until 2016 And in FY 2017, the large decrease is a result of the 5.6M ft2 at EM s Portsmouth Gaseous facility being reclassified from Undergoing Stabilization to Standby For Both "Utilized GSF" & "Total GSF" Data: Fiscal Year = applicable FY's Status = Operating, (Blank), Outgranted, or Standby Property Type = Building or Trailer For "Utilized GSF " Data: Sum of Utilized SqFt Note: UtilizedGSF = (Util-Asset% Utilized 100 x Gross/Rentable SqFt) For "Total GSF" Data: Sum of Gross/Rentable SqFt 22 of 40
5 - Utilization Office Usable Square Feet 23 of 40
5 Utilization Office Occupancy Rate Util-Office Usable SF Total No of Occupants Office Occupancy Rate Only started collecting data about usable office space for the first time in 2014, and data does not yet appear complete for all assets in FIMS. So this measure does not yet provide an accurate reflection of the Department s actual Occupancy Rate since the numbers are based on limited data For "Total Office Usable Sqft" & "Total No. of Occupants" Data: Fiscal Year = applicable FY per row Status = Operating, (Blank), Outgranted, or Standby Util-Office Usable SF <> (Blank) For "Office Usable Sqft" Data: Sum of Util-Office Usable SF For "Total Number of Occupants" Data: Sum of Total No of Occupants # of Occupants in Buildings & Trailers with identified Usable Office Space: 110,512 Total Occupants across the DOE: 142,728 % of Occupants in Buildings & Trailers with identified usable office space: 77% 24 of 40
6 - Disposition Overview Measures: Excess Property Index and Excess Disposition Index Purpose: To show the degree to which the Department is holding and disposing of excess property Calculations: Excess Property Index Excess Disposition Index Size (SqFt) of Assets with Excess Facility Indicator = Y Size (SqFt) of Assets Archived in the Reporting Year Buildings & Trailers: X 100 X 100 Total Size (SqFt) Total Size (SqFt) RPV of Assets RPV of Assets with Excess Facility Indicator = Y Archived in the Reporting Year OSFs: X 100 X 100 Total RPV Total RPV Size (Acres) of Assets Archived in the Reporting Year Size (Acres) of Assets with Excess Facility Indicator = Y Land: X 100 X 100 Total Size (Acres) Total Size (Acres) 25 of 40
6 Disposition Excess Property Index Size (SqFt) of Assets with Excess Facility Indicator = Y X 100 Total Size (SqFt) Excess Property Index Buildings and Trailers Shows how much excess property DOE currently has in its portfolio Bump in 2016 is a result of some large buildings being declared excess during that year: - EM Portsmouth Gaseous Site, Process Building: over 2.5M ft2 declared excess - NNSA's Kansas City National Security Campus Site, Manufacturing Building: over 3.5M ft2 For Both "SqFt of Excess Property" & "Total SqFt" Data: Sum of Size Fiscal Year = applicable FY's Property Type = Building or Trailer For "SqFt of Excess Property" Data: Excess Indicator = Y 26 of 40
6 Disposition Excess Property Index RPV of Assets with Excess Facility Indicator = Y X 100 Total RPV Excess Property Index OSFs Large increase in 2016 due to some large OSFs being declared excess during the year: - Office of River Protection: Single Shell Tank Farm over $450M - Savannah River Site: Multiple OSF Assets over $600M combined - East Technology Park: Multiple OSF Assets over $200M combined 2017 change is primarily a result on an increase in RPV for EM s Office of River Protection site at Hanford, WA (especially the Single Shell Tank Farm) - but based on FIMS data, it appears this is mostly an adjustment to RPV rather than an increase in assets or capacity For Both "RPV of Excess Property" & "Total RPV" Data: Sum of RPV Fiscal Year = applicable FY's Property Type = OSF For "RPV of Excess Property" Data: Excess Indicator = Y 27 of 40
6 Disposition Excess Property Index Size (Acres) of Assets with Excess Facility Indicator = Y X 100 Total Size (Acres) Excess Property Index Land For Both "Acres of Excess Property" & "Total Acres" Data: Sum of Size Fiscal Year = applicable FY's Property Type = Land For "Acreage of Excess Property" Data: Excess Indicator = Y 28 of 40
Size (SqFt) of Assets Archived in the Reporting Year 6 Disposition Excess Disposition Index X 100 Total Size (SqFt) RPV of Assets Archived in the Reporting Year X 100 Total RPV Excess Disposition Index Buildings & Trailers Excess Disposition Index OSFs For "SqFt of Assets Archived" Data: Sum of Archived Size Archived Disposition Year = applicable FY's Archived Property Type = Building or Trailer Archived Disposition Method <> Admin Correction/No Disposal For "Total SqFt" Data: Sum of Size Fiscal Year = applicable FY's Property Type = Building or Trailer For "RPV of Assets Archived" Data: Sum of Archived RPV Archived Disposition Year = applicable FY's Archived Property Type = OSF Archived Disposition Method <> Admin Correction/No Disposal For "Total RPV" Data: Sum of RPV Fiscal Year = applicable FY's Property Type = OSF 29 of 40
6 Disposition Current Excess Property by Excess Declaration Date 2017 Excess Property (B&T) by Declaration Date For "SqFt Declared Excess" Data: Sum of Size Fiscal Year = latest FIMS snapshot FY Excess Year = applicable year per row Property Type = Building or Trailer Excess Indicator = Y 30 of 40
7 - Management Overview Measures: Deferred Maintenance Index and Maintenance Investment Index Purpose: To show the degree to which the DOE invests in and maintains real property in a sustainable and cost effective manner Calculations: Maintenance Investment Index Deferred Maintenance Index Buildings, Trailers, & OSF s Deferred Maintenance Annual Actual Maintenance X 100 X 100 RPV RPV 31 of 40
7 Management Deferred Maintenance Index Deferred Maintenance X 100 RPV Increase in 2014 largely due to significant increase in DM at Savannah River Site (over $400M increase in DM) Deferred Maintenance Index Decrease in 2015 also primarily a result of changes at Savannah River Site but NOT due to changes in DM... Instead, due to large increases in RPV for some assets: - Canyon Bldg $2.7B RPV increase - Reactor Bldg $8.0B RPV increase - Vitrification Bldg $2.6B increase For Both "Deferred Maint" & "RPV" Data: Fiscal Year = applicable FY's Ownership = DOE Owned (O) For "Deferred Maintenance" Data: Sum of Deferred Maintenance For "RPV" Data: Sum of RPV DM Trend In Actual $ (not indexed) 32 of 40
7 Management Maintenance Investment Index Annual Actual Maintenance X 100 RPV DOE s target is to spend 2%- 4% of RPV in maintenance each year (per National Research Council Publication Committing to the Cost of Ownership , 1990) While some individual assets may achieve the 2-4% range, the Department as a whole is consistently below that target Eventually looking to replace this metric with Maintenance Budget Index - Compares Annual Actual Maintenance to Annual Required Maintenance - Tailors measure to actual, identified requirements - Eliminates cookie cutter 2-4% approach Maintenance Investment Index Target: Maintenance = 2% - 4% of RPV For Both "Annual Actual Maint" & "RPV" Data: Fiscal Year = applicable FY's Ownership = DOE Owned (O) Status = Operating, (Blank), Outgranted, or Standby For "Annual Actual Maintenance" Data: Sum of Annual Actual Maintenance For "RPV" Data: Sum of RPV 33 of 40
# of Assets w/ ARM > 0 X 100 ARM >0 7 Management Annual Required Maintenance Total # of Assets # of Assets w/ ARM = 0 ARM =0 X 100 Total # of Assets Annual Required Maintenance (ARM) is now a required for all assets per the new 430.1c Populating Annual Required Maintenance Data % of Assets with ARM Populated 100 20 As of the FIMS 2017 snapshot, 80% of assets have identified ARM 30 36 38 80 43 26 60 25 19 17 16 40 54% of all assets have identified an ARM > 0 54 45 45 45 41 20 0 2013 2014 2015 2016 2017 26% of all assets have an ARM of 0 Fiscal Year ARM > 0 ARM = 0 ARM is Blank For all Data: Fiscal Year = applicable FY per row Property Type = Building, Trailer, or OSF For "Percent >0" Data: % of Total Assets where Annual Required Maintenance is greater than zero For "Percent =0" Data: % of Total Assets where Annual Required Maintenance value equals zero For "Percent Blank" Data: 100% minus "% = 0" from abobve minus "% > 0" from above 34 of 40
8 Data Reliability Overview Measure: Data Reliability Index Purpose: To show the degree to which DOE s real property data is accurate and complete Calculation: Number of Green FIMS Validation Scorecards X 100 Total Number of Scorecards 35 of 40
8 Data Reliability Data Reliability Index Number of Green FIMS Validation Scorecards X 100 Total Number of Scorecards Data Reliability Index 36 of 40
8 Data Reliability Data Reliability Index by Category 37 of 40
8 Data Reliability Red Scorecards by Program 38 of 40
8 Data Reliability Red Scorecards by Cause 39 of 40
Questions? Contact Info Eric Haukdal eric.haukdal@hq.doe.gov 202.287.1317 40 of 40


 of Assets")