Static Program Instrumentation Review
Dive into a review of static program instrumentation, exploring the concepts of Steensgard's analysis and Andersen's analysis. Understand how Steensgard's analysis might lead to false-positive points-to relationships in certain programs, while Andersen's analysis can avoid such inaccuracies. Learn about the use of measurement probes in static instrumentation for proactive software evaluation.
Download Presentation

Please find below an Image/Link to download the presentation.
The content on the website is provided AS IS for your information and personal use only. It may not be sold, licensed, or shared on other websites without obtaining consent from the author. If you encounter any issues during the download, it is possible that the publisher has removed the file from their server.
You are allowed to download the files provided on this website for personal or commercial use, subject to the condition that they are used lawfully. All files are the property of their respective owners.
The content on the website is provided AS IS for your information and personal use only. It may not be sold, licensed, or shared on other websites without obtaining consent from the author.
E N D
Presentation Transcript
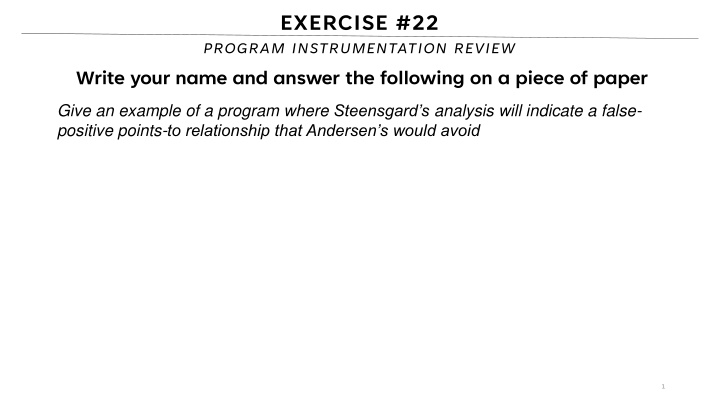
EXERCISE #22 PROGRAM INSTRUMENTATION REVIEW Write your name and answer the following on a piece of paper Give an example of a program where Steensgard s analysis will indicate a false- positive points-to relationship that Andersen s would avoid 1
EXERCISE #22 SOLUTION PROGRAM INSTRUMENTATION REVIEW 2
ADMINISTRIVIA AND ANNOUNCEMENTS
STATIC INSTRUMENTATION EECS 677: Software Security Evaluation Drew Davidson
5 PREVIOUSLY: PROGRAM INSTRUMENTATION REVIEW: LAST LECTURE ALTERTHEPROGRAMTOGAINMORE INFORMATIONOUTOFDYNAMICANALYSIS TWOFORMSOFINSTRUMENTATION Static instrumentation Alter the program statically, to gain information at runtime Dynamic instrumentation Alter the program at runtime, potentially leveraging runtime info
6 THIS LESSON: STATIC INSTRUMENTATION REVIEW: LAST LECTURE INSERTINGMEASUREMENTPROBES INTOAPROGRAM BEFOREITISRUN More closely associated with proactive software evaluation (why?)
7 STATIC INSTRUMENTATION TOOLS PROGRAM INSTRUMENTATION: APPROACH OFTENBUILTRIGHTINTOCOMPILER LLVM Coverage tools GCC Coverage tools SOMETIMESBUILTUPONOPTIMIZER Google s closure compiler https://github.com/google/closure-compiler
LECTURE OUTLINE Example: Test Coverage Using LLVM Instrumentation Developing LLVM Instrumentation
9 TEST COVERAGE EXAMPLE: TEST COVERAGE HOWDOWEKNOWIFOURTEST SUITEISSUFFICIENT? Line/branch/path coverage How many lines/branches/paths of the program does suite exercise?
10 TEST COVERAGE EXAMPLE: TEST COVERAGE HOWDOWEKNOWIFOURTEST SUITEISSUFFICIENT? 1: int f(bool b) { 2: Obj * o = null; 3: int v = 2; 4: if (b) { 5: 6: 7: } 8: if (v == 2){ 9: 10: } 11: return o->property(); 12: } Line/branch/path coverage How many lines/branches/paths of the program does suite exercise? o = new Obj (); v = rand_int(); o->setInvalid();
11 ASSESSING COVERAGE PROGRAM INSTRUMENTATION: APPROACH 1: int f(bool b) { 2: Obj * o = null; 3: int v = 2; 4: if (b) { 5: 6: 7: } 8: if (v == 2){ 9: 10: } 11: return o->property(); 12: } 13: BIG IDEA: INJECT COUNTERS Simple: Add a counter at every instruction Better: Add a counter at every basic block o = new Obj (); v = rand_int(); WHATCOVERAGEINFORMATIONDOESTHISGIVE US? Instruction: Yes! Branch: Yes! Path: No! o->setInvalid();
12 EFFICIENT PATH AND BRANCH COUNTERS PROGRAM INSTRUMENTATION: APPROACH BALLAND LARUS 96 Intuition: - Assign integer values to edges such that no two paths compute the same path sum (Section 3.2). Select edges to instrument using a spanning tree
13 BRANCH FREQUENCY PROGRAM INSTRUMENTATION: APPROACH NA VE APPROACH: INSTRUMENT PROBESATEACHEDGE Inefficient! We don t really need an A -> B counter (it s the sum of the B-> C and B -> D counters)
14 PATH FREQUENCY REVIEW: THE PROBLEM
15 EXAMPLE: COVERAGE / FREQUENCY PROGRAM INSTRUMENTATION: APPROACH EXAMPLEOFINSTRUMENTATION: COUNTING EXECUTION FREQUENCY Why is this useful? (Placing sanitizers) Let s first consider inserting edge counters Inefficient! We don t really need an A -> B counter (it s the sum of the B-> C and B -> D counters)
LECTURE OUTLINE Example: Test Coverage Using LLVM Instrumentation Developing LLVM Instrumentation
17 SETUP / ASSUMPTIONS LLVM BUILT-IN INSTRUMENTATION THISPORTIONOFTHELECTUREUSESACLANG++ INSTALLATION. Should work for many versions of LLVM (tested on clang++-18) Works on clang++14 (which is installed on the cycle servers) INSTALLATION (ONALOCALMACHINE) sudo apt install clang++ llvm-dev
18 LLVM COVERAGE INSTRUMENTATION LLVM BUILT-IN INSTRUMENTATION GOAL: ASSESSTHECOVERAGEOFATESTSUITE APPROACH: USELLVM SBUILT-IN INSTRUCTION INSTRUMENTATION Piggyback on LLVM s PGO facilities Profile-guided optimization 1) Insert PGO probes 2) Interpret probes as coverage measurements
19 LLVM: INSERTING PGO PROBES LLVM BUILT-IN INSTRUMENTATION -fcoverage-mapping Map instrumentation results to source code -fprofile-instr-generate Generate profile information at the source instruction level -fprofile-generate Generate profile information at the IR level
20 LLVM: INSERTING PGO PROBES LLVM BUILT-IN INSTRUMENTATION Let s write a simple LLVM program, then observe the probes clang++ prog.c o prog -fprofile-instr-generate emit-llvm -fcoverage-mapping This will cause the program to output an additional coverage file in the location of the environment variable LLVM_PROFILE_FILE export LLVM_PROFILE_FILE=test1.prof
21 LLVM COVERAGE INSTRUMENTATION LLVM BUILT-IN INSTRUMENTATION GOAL: ASSESSTHECOVERAGEOFATESTSUITE APPROACH: USELLVM SBUILT-IN INSTRUCTION INSTRUMENTATION Piggyback on LLVM s PGO facilities 1) Insert PGO probes 2) Interpret probes as coverage measurements
22 LLVM: COVERAGE REPORT LLVM BUILT-IN INSTRUMENTATION The profile file is useful for a variety of things (i.e. PGO). As such, it is not (immediately) human-readable We ll use some extra tools to generate a readable report llvm-profdata merge -sparse test1.prof -o final.profdata llvm-cov-14 show badcalc -instr-profile=final.profdata >& profile.report
23 PUTTING IT ALL TOGETHER REVIEW: LAST LECTURE THESECOMMANDSWORKFINEFOR 1 TESTRUN, BUTWECAREABOUTTEST SUITES clang++-18 prog.ll o prog -fprofile-instr-generate -fcoverage-mapping export LLVM_PROFILE_FILE=test1.prof ./prog export LLVM_PROFILE_FILE=test2.prof ./prog llvm-profdata merge -sparse test*.prof -o final.profdata llvm-cov-18 show prog -instr-profile=final.profdata >& profile.report
24 EXAMPLE: LLVM COVERAGE INSTRUMENTATION PROGRAM INSTRUMENTATION: APPROACH LET STAKEITTOTHETERMINAL!
LECTURE OUTLINE Example: Test Coverage Using LLVM Instrumentation Developing LLVM Instrumentation
26 CUSTOM INSTRUMENTATION PROGRAM INSTRUMENTATION: APPROACH THE PREVIOUS EXAMPLETOOKADVANTAGEOFPRE-EXISTING INSTRUMENTATION What if we wanted to make our own custom instrumentation?
27 CUSTOM INSTRUMENTATION PROGRAM INSTRUMENTATION: APPROACH GETTINGSTARTED 1) Reference the LLVM API 2) Build our own (trivial) analysis pass 3) Hook into the LLVM opt infrastructure 4) Run our analysis pass GOING FURTHER Insert more full-featured functionality (https://llvm.org/doxygen/classllvm_1_1IRBuilder.html)
28 EXAMPLE: LLVM CUSTOM INSTRUMENTATION PROGRAM INSTRUMENTATION: APPROACH LET SREMOVEAND ADDSOMEINSTRUCTIONS! Consider a simple add2 program: #include <stdio.h> int main(int argc, const char** argv) { int num; scanf("%i", &num); printf("%i\n", num + 2); return 0; } Let s change this to a multiply
29 EXAMPLE: LLVM CUSTOM INSTRUMENTATION PROGRAM INSTRUMENTATION: APPROACH LET STAKEITTOTHETERMINAL!
30 WRAP-UP WE VE DESCRIBED THE THEORY AND PRACTICE OF PROGRAM INSTRUMENTATION Next time: Consider how we generate test cases
31 WRAP-UP WE VE DESCRIBED 2 FORMS OF ALTERING THE PROGRAM More heuristic by nature
32 LLVM: COVERAGE MAPPING LLVM BUILT-IN INSTRUMENTATION For understanding line coverage, we need to map changes to source code clang++ prog.c o prog -fprofile-instr-generate emit-llvm -fcoverage-mapping This will cause the program to output an additional coverage file in the location of the environment variable LLVM_PROFILE_FILE export LLVM_PROFILE_FILE=test1.prof


