Explore statistical analysis with mean and standard deviation calculations, box plots, comparison of tire lap times, depreciation of assets, and prediction of house values. Enhance your understanding of data interpretation and financial computations.
Please find below an Image/Link to download the presentation.
The content on the website is provided AS IS for your information and personal use only. It may not be sold, licensed, or shared on other websites without obtaining consent from the author. If you encounter any issues during the download, it is possible that the publisher has removed the file from their server.
You are allowed to download the files provided on this website for personal or commercial use, subject to the condition that they are used lawfully. All files are the property of their respective owners.
The content on the website is provided AS IS for your information and personal use only. It may not be sold, licensed, or shared on other websites without obtaining consent from the author.
E N D
Presentation Transcript
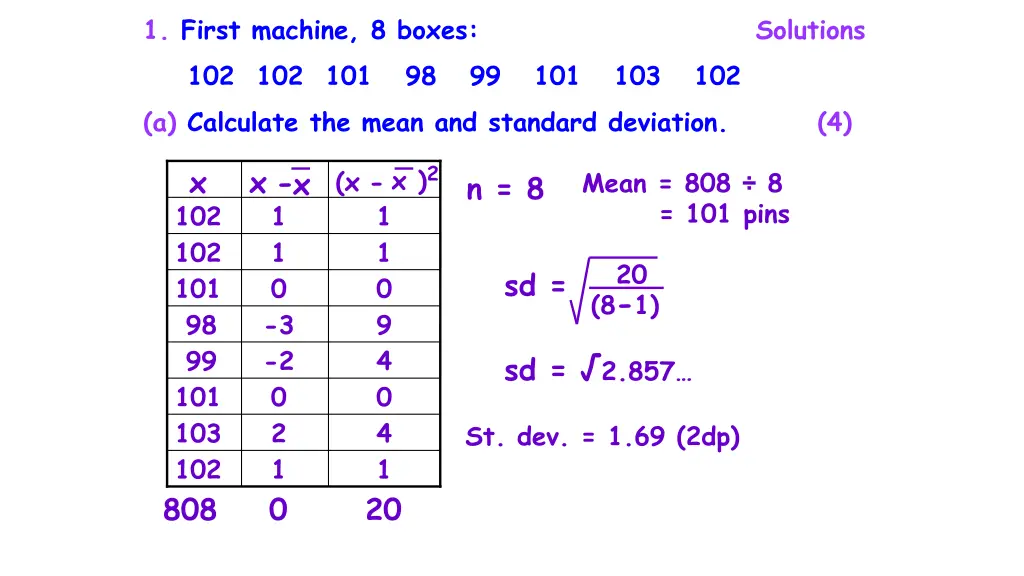
1. First machine, 8 boxes: Solutions 102 102 101 98 99 101 103 102 (a) Calculate the mean and standard deviation. (4) x )2 1 x x- 1 x (x- Mean = 808 8 = 101 pins n = 8 102 102 1 1 20 sd = 101 0 0 (8-1) 98 -3 9 99 -2 4 sd = 2.857 101 0 0 103 2 4 St. dev. = 1.69 (2dp) 102 808 0 20 1 1
Q3. Calculator allowed, if needed. Median = 17.50 Q1 = 9.50 Q3 = 21 , and (a) (b) Use the data from the stem and leaf diagram to construct a box plot Profit 6 14 10 26 18 22 34 30
Q4. Goodhold tyres lap times, in seconds: 81.8 81.7 81.6 81.0 80.3 80.2 (a) Calculate the mean and standard deviation. (4) x- 0.7 x )2 x x (x- 0.49 Mean = 486.6 6 = 81.1 seconds n = 6 81.8 81.7 0.6 0.36 sd = 2.56 81.6 0.5 0.25 5 81.0 -0.1 0.01 80.3 -0.8 0.64 sd = 0.512 St. dev. = 0.7155.. = 0.72 seconds (2dp) 80.2 486.60 2.56 -0.9 0.81
Q4. Fraser changed the tyres to Megagrip tyres and recorded another six laps. These times produced a mean of 81.6 seconds and standard deviation of 0.65 seconds. (b) Make two valid comments comparing the two types of tyres. (2) On average, the lap times on the Goodhold tyres were faster, shown by the lower mean (81.1< 81.6 seconds). The lap times on the Megagrip tyres varied less, shown by the lower standard deviation (0.65 < 0.72 seconds).
Q5. A car costs 15600 when new. It depreciates in value by 6.5% each year. What is it worth when it is sold 3 years later? Give your answer correct to 3 sig. figures. Depreciation Multiplier = (100 - 6.5) = 0.935 100 Value in 3 years = 15600 x 0.9353 = 12751.44585 Value = 12751.45 To 3 sig figs = 12800
Q6. It is estimated that house prices will increase at the rate of 3.15% per annum. A house is valued at 134750. If its value increases at the predicted rate, calculate its value after 3 years. Give your answer to 3 significant figures. Increase Appreciation = (100 + 3.15) = 1.0315 100 Value in 3 years = 134750 x 1.03153 Value = 147889.20 3 sig figs = 148000
Q8. Fiona paid 78000 for her house ten years ago. She sold it recently for 109000. Calculate the percentage profit Fiona made. Give your answer to 2 significant figures. Profit made = 109000 78000 = 31000 Profit fraction = 31000 = 31 78000 78 % profit = 31 of 100% 78 % profit = 100 78 x 31 % profit = 39.7425 % profit = 40% (2sf)
Q9. (a) How much is John s gross weekly pay? Gross weekly pay = 8.50 x 40 Non calc.? Gross weekly pay = 340 Gross monthly pay = 8.50 x 160 = 1360 Total Deductions = 190 + 118 + 82 = 390 Monthly take home pay = 1360 - 390 = 970
Q10. (a) Gross monthly pay = 9.70 x 180 = 1746 (b) (10%) Pension = 1746 10 = 174.60 Total Deductions = 380 + 208.40 + 174.60 = 763 Take home pay = 1746 - 763 = 983
Q10. (b) Take home pay = 983 c) After all these Expenses, what percentage of her take home pay does Chloe have left? Total Expenses = 600 Money left = 983 - 600 = 383 Fraction of pay = 383 983 % left = 100 983 x 383 = 38.9623 % take home pay left = 39% (to nearest %) % Left = 383 of 100% 983
Q11. to $US = 4000 x 1.85 = $7400 Spends = 350 x 7 = $US2450 $US left = 7400 - 2450 = $US4950 $US to $Can = 4950 x 0.85 = $Can4207.50 Spends = 290 x 4 = $Can1160 $Can left = 4207.50 - 1160 = $Can3047.50 To nearest $Can1000 = $Can3000
Q12. time-and-a-half for each hour at the weekend. His shifts this week are shown below. Mon = 9 basic hours Tues = 9 basic hours Wed = 8 basic hours Fri = 4 basic hours Sat = 3 OT hours = 3 x 1.5 = 4.5 basic hours Total hours = 9 + 9 + 8 + 4 + 4.5 = 34.5 hours Wages for week = 34.5 x 12.40 = 427.80
Q13. 0730-0900 = 1.5 basic hours = 14.40 x 1.5 = 21.60 each shift 2300-0730 = 8.5 OT hrs = 14.40 x 1.5 x 8.5 = 183.60 each shift Wages for 1 shift = 21.60 + 183.60 = 205.20 Gross weekly pay = 205.20 x 5 = 1026
Q14(b). 2019 value = 1816000 Increase Appreciation = (100 + 1.25) = 1.0125 100 Population in 5 years = 1816000 x 1.01255 Population = 1932373.191 To nearest 1000 = 1932000


.")
.")