Explore various statistical analysis outputs and interpretations related to conduction velocity, regression analysis, variation in speed, gender differences in winning time, and more in the biomedical science field. Understand concepts such as F calculations, residuals, slope significance, and interaction effects in data analysis.
Please find below an Image/Link to download the presentation.
The content on the website is provided AS IS for your information and personal use only. It may not be sold, licensed, or shared on other websites without obtaining consent from the author. If you encounter any issues during the download, it is possible that the publisher has removed the file from their server.
You are allowed to download the files provided on this website for personal or commercial use, subject to the condition that they are used lawfully. All files are the property of their respective owners.
The content on the website is provided AS IS for your information and personal use only. It may not be sold, licensed, or shared on other websites without obtaining consent from the author.
E N D
Presentation Transcript
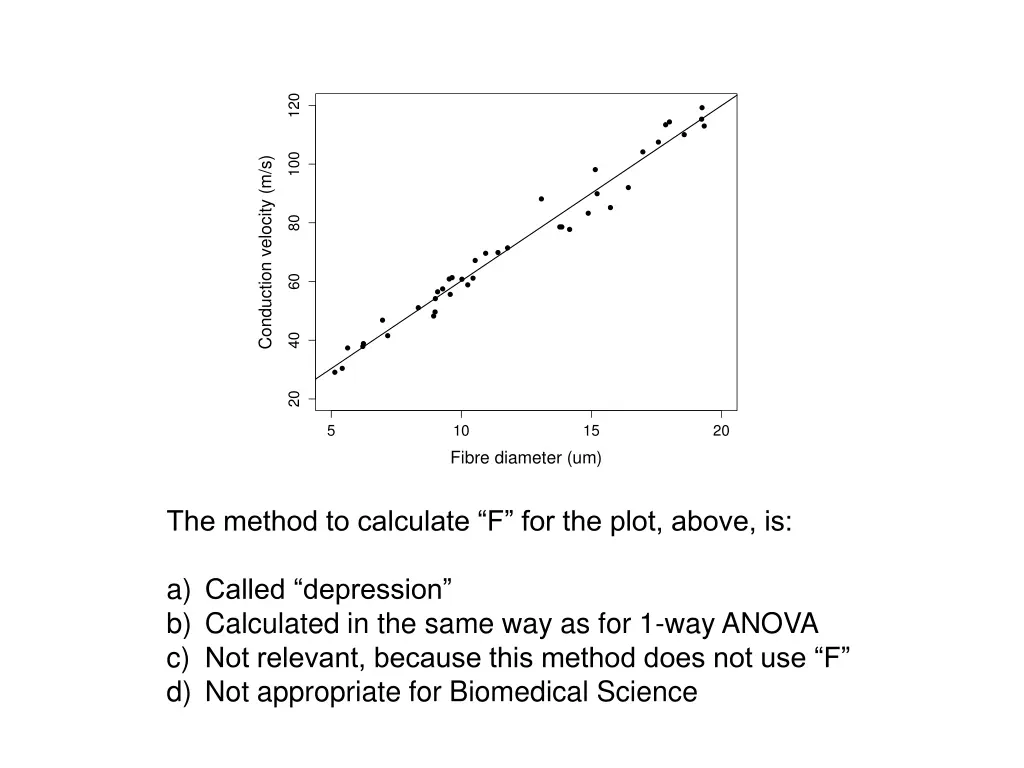
120 100 Conduction velocity (m/s) 80 60 40 20 5 10 Fibre diameter (um) 15 20 The method to calculate F for the plot, above, is: a) Called depression b) Calculated in the same way as for 1-way ANOVA c) Not relevant, because this method does not use F d) Not appropriate for Biomedical Science
This plot of residuals: a) was obtained from an analysis of 1 factor with 3 levels b) indicates that the residuals are normally distributed c) Indicates that the data are not independent d) suggests that the data meet the assumption of equal variance
This output for a regression analysis reveals that: a) the slope of the line equals 0.5219 b) the SE for the slope equals 2.0025 c) the y-intercept equals 0.796 d) the slope of the line differs from zero (strong evidence)
This output for a regression analysis reveals: a) strong evidence that the slope differs from zero b) no evidence that the slope is differs from zero c) evidence that the slope differs from three d) evidence that the slope differs from six
Results for an analysis that includes one Factor (with 2 levels, coded red and blue) and one Covariate This result is consistent with: a) an interaction between the factor and covariate b) a negative relationship between x and the response c) a regression analysis d) the musical score from the movie, No Country for Old Men
Results for an analysis that includes one Factor (with 2 levels, coded red and blue) and one Covariate This plot suggests: a) the effect of the covariate depends on the level of the Factor b) the response decreases with x c) the factor does not affect the response d) the level of the response affects x
Results for an analysis that includes one Factor (with 2 levels, coded red and blue) and one Covariate This plot suggests that the magnitude of the effect of the Factor depends on the value of the covariate (called, x ): a) TRUE b) FALSE
Results for an analysis that includes one Factor (with 2 levels, coded red and blue) and one Covariate This plot suggests: a) the effect of the covariate depends on the level of the Factor b) there is no interaction between the factor and covariate c) the factor does not affect the response d) the covariate does not affect the response
Results for an analysis that includes one Factor (with 2 levels, coded red and blue) and one Covariate A result like this allows you to calculate the effect of a factor while adjusting for the effect of a covariate: a) TRUE b) FALSE
CellType is a factor with two levels: Myelinated and Unmyelinated thickness is a covariate Determine the two slopes for this model: a) 0.5219 and 5.9705 b) 5.9705 and 1.8109 c) 0.5219 and 2.3328 d) 5.9705 and 0.3595
CellType is a factor with two levels: Myelinated and Unmyelinated thickness is a covariate Determine the two y-intercepts for this model: a) 0.5219 and 5.9705 b) 5.9705 and 1.8109 c) 0.5219 and 2.3328 d) 5.9705 and 0.3595
CellType is a factor with two levels: Myelinated and Unmyelinated thickness is a covariate With results line this, our next action would be: a) Interpret the main effect of thickness b) Calculate the effect size for CellType c) Calculate the slope (of thickness ) for each level of CellType d) Remove the interaction from the model and run it again


 what")