Statistical Analysis of Benzene Detection Method in Blood
The exercise involves determining the critical level, minimum detectable value, confidence intervals, and regression analysis for benzene concentration measurements in blood samples. Key calculations include critical level estimation, confidence intervals determination, and regression analysis for zinc concentration in water samples. Assumptions of regression analysis and weighted least squares method for calibration curve estimation are evaluated.

Uploaded on Feb 28, 2025 | 1 Views
Download Presentation

Please find below an Image/Link to download the presentation.
The content on the website is provided AS IS for your information and personal use only. It may not be sold, licensed, or shared on other websites without obtaining consent from the author.If you encounter any issues during the download, it is possible that the publisher has removed the file from their server.
You are allowed to download the files provided on this website for personal or commercial use, subject to the condition that they are used lawfully. All files are the property of their respective owners.
The content on the website is provided AS IS for your information and personal use only. It may not be sold, licensed, or shared on other websites without obtaining consent from the author.
E N D
Presentation Transcript
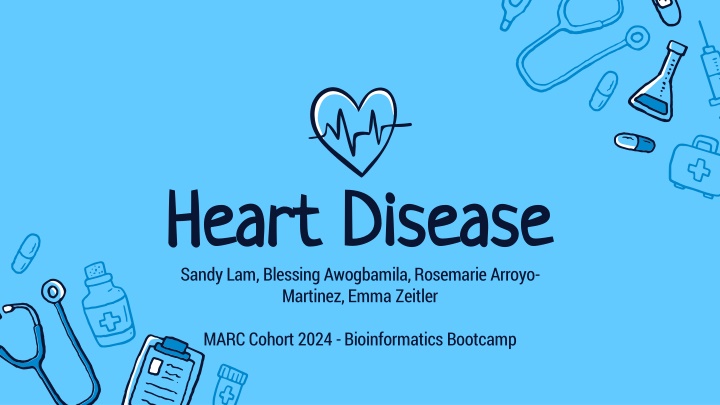
Heart Disease Heart Disease Sandy Lam, Blessing Awogbamila, Rosemarie Arroyo- Martinez, Emma Zeitler MARC Cohort 2024 -Bioinformatics Bootcamp
Overview Overview 01 01 02 02 03 03 Heart Disease Machine Learning Research Question Introduction and why it is important What is machine learning? How did we use it? What question did we seek to answer? 04 04 05 05 Data Analysis Importance What we found? How the data is relevant
01 01 Heart Disease Heart Disease $229 billion 34 seconds 1 in 5 people Cost of healthcare services dedicated to heart disease treatment. 1 person dies every 34 seconds from a cardiovascular disease. Heart disease is the leading cause of death in the United States. That is about 697,000 people.
02 02 What is Bioinformatics? What is Bioinformatics? The application of computational tools in the analysis of biological data Involves the management and analysis of large collections of data A great example would be the large data sets of patients in medical care
Machine Learning (ML) Machine Learning (ML) ML is a subset of artificial intelligence Defined as the capability of a machine to imitate human intelligence and to learn without explicit instruction by using algorithms and statistical models Used for data analysis and draws inferences from patterns in data
03 03 Does gender, race, and age Does gender, race, and age contribute to heart disease? contribute to heart disease?
Unsurprisingly, heart disease is more Unsurprisingly, heart disease is more prominent in the older generation. The risk of prominent in the older generation. The risk of heart disease is higher in the Native heart disease is higher in the Native American and Black community specifically in American and Black community specifically in males than women even if the mortality rate males than women even if the mortality rate for women is higher. for women is higher.
04 04 Methodology Methodology ML algorithms was used to analyze heart disease data and how age, sex, and race impacted the accuracy of heart disease prediction. Amarel Cluster was used as a means to access R (programming language) to analyze data -access permitted by the Office of Advanced Research Computing (OARC) Packages Used: RandomForest, Boruta, ROSE, mlbench, caret, ROCR
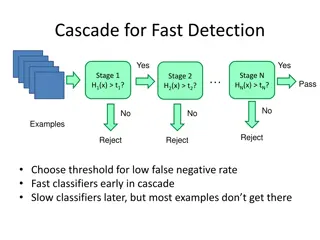
Pipeline of Machine Learning Method Pipeline of Machine Learning Method 1. Acquire data (provided by CDC) 2. Prepare data (clean and balance data) 3. Choose model (classification model Y/N)(categorizes data to draw conclusion ) 4. Train the model (passed the prepared data to ML model) 5. Evaluate the model (done during training stage) 6. Parameter tuning (make adjustments to optimize model) 7. Run model on test data set 8. Use the model in making predictions with new data set
Attributes Attributes - - - - - - - - - Heart Disease (Y/N) Body Mass Index (BMI) Smoking (Y/N) Alcohol Drinking (Y/N) Stroke (Y/N) Physical Health Mental Health Difficulty Walking (Y/N) Sex (M/F) - - - - - - - - - Age Category Race Asthma (Y/N) Sleep Time Physical Activity General Health Kidney Disease (Y/N) Skin Cancer (Y/N) Diabetic (Y/N) **Data provided by the CDC**
Factors Factors All attributes but alcohol drinking were found to be important Age, stroke, difficulty walking, diabetes, and general health were found to be the five most useful attributes in heart disease prediction **Data provided by the CDC**
Accuracy of Model Accuracy of Model After training the machine, it calculated the accuracy of heart disease prediction 75.7% **Data provided by the CDC**
ROC Curve ROC Curve Receiver operating characteristic curve compares the true positive rate to the false positive rate Area under the curve (AUC)- 0.8198941 The closer to 1, the more accurate **Data provided by the CDC**
Mean Decrease Accuracy Mean Decrease Accuracy Mean Decrease Accuracy- how much accuracy decreases if that attribute was removed Mean Decrease Gini- measure of variable importance based on the Gini Impurity Index **Data provided by the CDC**
Partial Dependence on Age Partial Dependence on Age Indicates at which age group is more likely to develop heart disease People between the ages of 18 and 24 were least likely to develop heart disease People 60 and older are progressively more likely to develop heart disease as they age **Data provided by the CDC**
Partial Dependence on Sex Partial Dependence on Sex Indicates which sex is more likely to develop heart disease Men are more than likely to develop heart disease than women
Partial Dependence on Race Partial Dependence on Race Indicates which races are more likely to develop heart disease People of White or Asian Descent are the least likely to develop heart disease, while Black and Native Americans are more likely to develop heart disease Asian
Comparison Comparison **Data provided by the CDC**
Conclusion Conclusion Previous studies has shown that age, sex, and race are indicators of heart disease. Based on our data analysis, race was not shown to be a major contributor in the prediction of heart disease; however, it was useful in increasing the accuracy of our model. Age and sex very both found to be major predictors of heart disease, in line with previous studies.
Machine Learning & Heart Disease Machine Learning & Heart Disease 05 05 As a leading cause of death in many countries, patients require quick diagnosis and early treatment Machine learning can be used to analyze previous heart disease data to predict future cases, expediting diagnosis
Test & Trials Test & Trials - New programming language - First time with machine learning - HPC environment - Maintenance limited time that was allotted to work - Troubleshooting - Teamwork
Acknowledgements Acknowledgements OARC (Office of Advanced Research Computing) - Galen Collier - Udi Zelzion MARC U*STAR Program - Kwangwon Lee - Nathan Fried
References References Amarel. Office of Advanced Research Computing. (2022, July 8). Retrieved August 18, 2022, from https://oarc.rutgers.edu/resources/amarel/ Centers for Disease Control and Prevention. (2022, July 15). Heart disease facts. Centers for Disease Control and Prevention. Retrieved August 18, 2022, from https://www.cdc.gov/heartdisease/facts.htm Heart Disease Risk: How Race and Ethnicity Play a Role. Cleveland Clinic, https://my.clevelandclinic.org/health/articles/23051-ethnicity-and-heart-disease. Accessed 18 Aug. 2022. Rodgers, Jennifer L., et al. Cardiovascular Risks Associated with Gender and Aging. Journal of Cardiovascular Development and Disease, vol. 6, no. 2, Apr. 2019, p. 19. PubMed Central, https://doi.org/10.3390/jcdd6020019. The Complete Guide to Machine Learning Steps. Simplilearn.Com, https://www.simplilearn.com/tutorials/machine-learning-tutorial/machine-learning-steps. Accessed 18 Aug. 2022. Yazdani, Armin, et al. A Novel Approach for Heart Disease Prediction Using Strength Scores with Significant Predictors. BMC Medical Informatics and Decision Making, vol. 21, no. 1, June 2021, p. 194. BioMed Central, https://doi.org/10.1186/s12911-021-01527-5.


")