Statistical Analysis of HbA1c and Metabolic Parameters Before and After Liraglutide Intervention
Analysis of relative changes in HbA1c, AUC of OGTT, body weight, serum insulin, and leptin levels in vehicle and liraglutide treated groups before and after intervention. Various statistical tests such as ANOVA, paired t-test, Wilcoxon test, and more were conducted to assess the effects of liraglutide. Results indicate significant improvements in metabolic parameters with liraglutide treatment.

Download Presentation

Please find below an Image/Link to download the presentation.
The content on the website is provided AS IS for your information and personal use only. It may not be sold, licensed, or shared on other websites without obtaining consent from the author.If you encounter any issues during the download, it is possible that the publisher has removed the file from their server.
You are allowed to download the files provided on this website for personal or commercial use, subject to the condition that they are used lawfully. All files are the property of their respective owners.
The content on the website is provided AS IS for your information and personal use only. It may not be sold, licensed, or shared on other websites without obtaining consent from the author.
E N D
Presentation Transcript
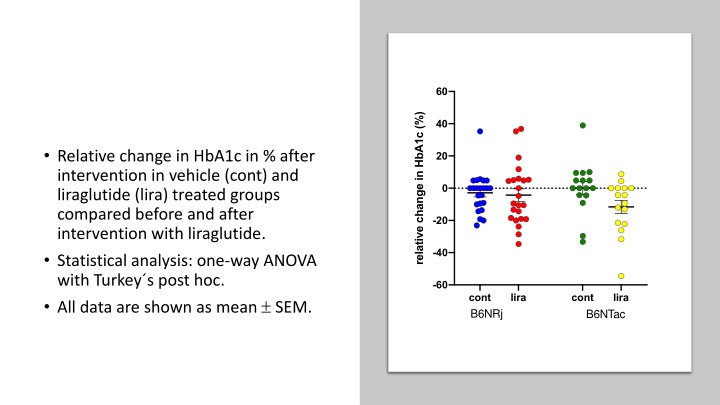
60 relative change in HbA1c (%) 40 Relative change in HbA1c in % after intervention in vehicle (cont) and liraglutide (lira) treated groups compared before and after intervention with liraglutide. Statistical analysis: one-way ANOVA with Turkey s post hoc. All data are shown as mean SEM. 20 0 -20 -40 -60 cont B6NRj lira cont lira B6NTac
HbA1c levels in liraglutide treated groups before and after intervention. Statistical analysis: B6NRj: paired t-test. B6NTac: Wilcoxon matched-pairs signed rank test. All data are shown as mean SEM. Differences denoted with ** p<0.01
Relative change in area under curve (AUC) of oral glucose tolerance test (OGTT) in % in vehicle (cont) and liraglutide (lira) treated groups compared before and after intervention with liraglutide. All data are shown as mean SEM. Statistical analysis: one-way ANOVA with Tukey s post hoc. Differences denoted with * p<0.05 ** p<0.01
Oral glucose tolerance test (OGTT) after intervention with liraglutide in vehicle (cont) and liraglutide (lira) treated groups. Fasting blood glucose measurement at t=0 and subsequent blood glucose measurements at 15 to 120 minutes after oral glucose challenge. Statistical analysis: repeated measurements two-way ANOVA with Turkey s post hoc and factors treatment and time . All data are shown as mean SEM.
Relative change in body weight in % during intervention with liraglutide in vehicle (cont) and liraglutide (lira) treated groups. Statistical analysis: Brown-Forsythe and Welch ANOVA test with Dunnett s T3 post hoc. All data are shown as mean SEM. Differences denoted with **** p<0.0001
Fasting serum insulin (pg/ml) in vehicle (cont) and liraglutide (lira) treated groups after intervention with liraglutide. Statistical analysis: Kruskal-Wallis test with Dunn s post hoc All data are shown as mean SEM. Differences denoted with *** p<0.001
Fasting serum leptin (pg/ml) in vehicle (cont) and liraglutide (lira) treated groups after intervention with liraglutide. Statistical analysis: Brown-Forsythe and Welch ANOVA test with Dunnett s T3 post hoc All data are shown as mean SEM. Differences denoted with * p<0.05, *** p<0.001, **** p<0.0001
Fasting blood glucose (mmol/l) in vehicle (cont) and liraglutide (lira) treated groups after intervention with liraglutide taken under oral glucose tolerance test (OGTT). Statistical analysis: Kruskal-Wallis test with Dunn s post hoc All data are shown as mean SEM. Differences denoted with ** p<0.01


")
 after")

 in")
 in")
 in")