Statistical Analysis on IQ Scores, Cold Attacks, Ambulance Response Times, and Hemoglobin Levels
Conducting statistical tests on various data sets including IQ scores, common cold attacks, ambulance response times, and hemoglobin levels to draw conclusions based on sample means and significance levels. Assumptions, hypothesis testing, and inferences are made to determine the effectiveness of treatments and differences between groups based on given data.

Download Presentation

Please find below an Image/Link to download the presentation.
The content on the website is provided AS IS for your information and personal use only. It may not be sold, licensed, or shared on other websites without obtaining consent from the author.If you encounter any issues during the download, it is possible that the publisher has removed the file from their server.
You are allowed to download the files provided on this website for personal or commercial use, subject to the condition that they are used lawfully. All files are the property of their respective owners.
The content on the website is provided AS IS for your information and personal use only. It may not be sold, licensed, or shared on other websites without obtaining consent from the author.
E N D
Presentation Transcript
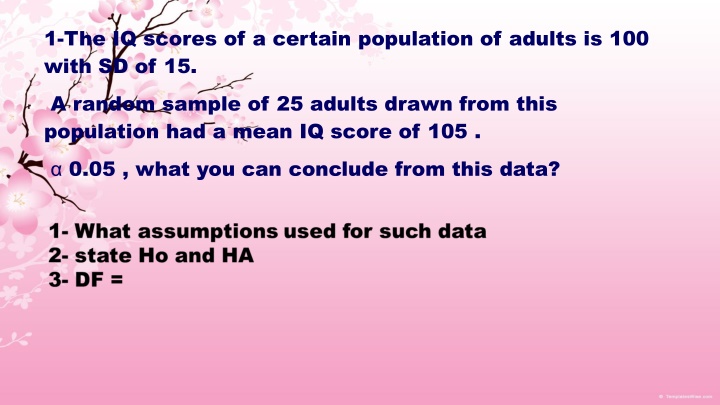
1-The IQ scores of a certain population of adults is 100 with SD of 15. A random sample of 25 adults drawn from this population had a mean IQ score of 105 . 0.05 , what you can conclude from this data?
2-In a developing countries, the average attacks of common cold was 4.5 per person . A sample of 20 persons drawn from the same population showed the number of attacks of cold per person as follows: 7; 2; 5; 0;1 ;5; 5; 6; 7; 6; 2; 6; 9; 4;8; 8; 6; 7; 9; 3 . By using 0.01 , what you can conclude from such data?
A random sample of 16emergency reports was selected from the files of an ambulance service. The mean time required from the sample for ambulances to reach their destinations was 13 minutes . Assume that the population of time is normally distributed with a variance of 9. Can we conclude that at the 0.05 level of significance that the population mean is greater than 10 minutes?
3-Thirty micrograms of vitamin B12 were given every fourth weeks to six patients of pernicious anemia during periods of treatment . The results are given below . Do the data indicate real improvement in hemoglobin level ? use 0.05.
Patient serial NO. Hb before therapy Hb after 3months therapy 1 2 3 4 5 6 12.2 11.3 14.7 11.4 11.5 12.7 13 13.4 16 13.6 14 13.8
1- What assumptions used for such data 2- state Ho and HA 3- DF = 4- Tab value = 5-equation for calculated value =
4-A group of 15 normal children in a study had a mean bilirubin level of 1.05 g % and SD 0.34 . Another group of 15 children with liver cirrhosis had mean bilirubin level of 4.99 g% and SD of 2.52 . By using 0.05 , what you can conclude from this study ?
5-The mean difference in systolic BP of 100 patients was 30 mmHg before and after treatment . Standard deviation difference was 10 mmHg . Using 0.05 prove statistically if the treatment was effective . 1-What statistical test used for this study 2- State assumption for this study 3- Mention H0 and HA 4-df = 5- prove statistically if the treatment was effective .
6-Serum protein is lower in females than in males . Justify this conclusion by applying appropriate statistical technique to the data given below : 0.01. sex Number Mean serum protein level SD MALES FEMALES 18 7 7.21 6.90 0.26 1.28
The erythrocyte sedimentation rate (mm/hour) of 15 male and 10 female TB patients before state of the treatment. Use n1 = 15 Mean = 88.73 SD=25.32 n2 =10 Mean = 94.90 SD= 15.76 1- What suitable test to be use ? 2- HA = 3- Df = 4-Tab value = 5- Equation for calculated value = 6- If the calculated value =0.75 . State your decision and conclusion
7-Constipation was considered to be a common feature as observed in 60% of typhoid cases . In a study of 500 typhoid cases , 30% had constipation . Can you considered constipation as a common feature of typhoid on this observation ? 0.05.
8-From a clinic 40 females using oral contraceptives and 60 females using other contraceptive devices were randomly selected and the number of hypertensive cases from both the groups were recorded as given below: Type of contraceptive Oral Other Total No. found hypertensive 8 15 40 60 Test the hypothesis that the proportion of patients with hypertension is the Same in the two groups. 0.05.
The 24-hours total energy consumption (in MJ/day) was determined for 13 skinny and 9 heavily over weighted women. Values for skinny women: 6.13, 7.05, 7.48, 7.48, 7.53, 7.58, 7.90, 8.08, 8.09, 8.11, 8.40, 10.15, 10.88 Values for heavy over weighted women: 8.79, 9.19, 9.21, 9.68, 9.69, 9.97, 11.51, 11.85, 12.79 a.) Is there a difference in energy consumption between both groups? Use 0.05
The effect of drug A and B was studied on ten patients separately . The results were assessed for the additional hours of sleep produced by the drugs . Addition hours of sleep 1 2 3 4 5 6 7 8 9 10 Drug A 0.7 1.6 0.2 1.2 0.1 3.4 3.7 0.8 0.1 2.0 Drug B 1.9 0.8 1.1 0.1 0.1 4.4 5.5 1.6 4.6 3.6
The mean plasma potassium level for 50 adult males with a certain disease was found to be 3.35 mEq / L and SD was 0.50 mEq/L . The normal adult value for plasma potassium is 4.6 1- state HA 2- Table value for : = Df= 3- equation for calculated t
A sample of eight patients admitted to a hospital with a diagnosis of biliary cirrhosis had a mean IgM level of 160.55 units per milliliter. The sample standard deviation was 50. The population mean of IgM is 150? 1- Mention Ho 2- define level of significance 3- Determine p value. (0.5967)
1-If there are two sets of data, one with 15 measurements and another with 47 measurements, how many degrees of freedom you use to find the critical value? a. 20 b. 47 c. 15 d. 60
2-Following the analysis of some data on two samples drawn from populations in which the variable of interest is normally distributed, the p-value for the comparison of the two sample means under the null hypothesis that the two population means are equal (H0 1 = 2) against HA : 1 6= 2 was found to be .0063. This p-value indicates that A -there is very little evidence in the data for a conclusion to be reached B -there is rather strong evidence against the null hypothesis C- the evidence against the null hypothesis is not strong D- the null hypothesis should be accepted E- there is rather strong evidence against the alternative hypothesis
3-The following are percentages of fat found in 5 samples of each of two brands of ice cream A 5.7 4.5 6.2 6.3 7.3 B 6.3 5.7 5.9 6.4 5.1 Which of the following procedures is appropriate to test the hypothesis of equal average fat content in the two types of ice cream a) Paired t-test with 5 df b) Two sample t-test with 8 df c) Paired t-test with 4 df d) Two sample t-test with 9 df
4-In testing a hypothesis about two population means, if the t distribution is used, which of the following assumptions is required a-Both populations are normally distributed b-The sample sizes are equal c-Both population means are the same d-The standard deviations are not the same
5-The t test for the difference between the means of two samples makes what assumption: a-Samples are randomly and independently drawn b-Populations are approximately normally distributed c-Sample variances are equal d-All of the above 6-For a one sample t test with sample size 58, the degrees of freedom is a-57 b-58 c- 59
7-A one sample t test is conducted on H 0 : = 81.6. The sample has equation, s = 3.1, and n = 25. The test statistic is a-0.806 b-1.803 c- 4.032
8-A study was set up to look at whether there was a difference in the mean arterial blood pressure between two groups of volunteers, after 6 weeks of following one of two treatment programs. One group of volunteers were given an exercise regimen to follow for the 6 weeks and the other group were given the same exercise regimen with the addition of an experimental tablet. Which type of t-test should be used in this situation? a) One sample t-test b)Independent samples t-test c)Paired samples t-test d)None of the t-tests would be suitable


 of 15 male and")


 was")