Statistical Approaches to Global Issues: Session 1
Statistical methods in addressing global concerns with a focus on women's collective action in Ethiopia, using data and insights to drive positive change. Discover the impact of empowering women smallholders through projects like the Researching Women's Collective Action.

Download Presentation

Please find below an Image/Link to download the presentation.
The content on the website is provided AS IS for your information and personal use only. It may not be sold, licensed, or shared on other websites without obtaining consent from the author.If you encounter any issues during the download, it is possible that the publisher has removed the file from their server.
You are allowed to download the files provided on this website for personal or commercial use, subject to the condition that they are used lawfully. All files are the property of their respective owners.
The content on the website is provided AS IS for your information and personal use only. It may not be sold, licensed, or shared on other websites without obtaining consent from the author.
E N D
Presentation Transcript
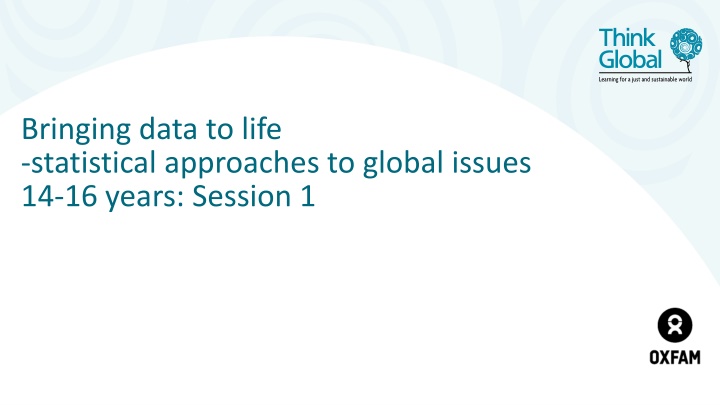
Bringing data to life -statistical approaches to global issues 14-16 years: Session 1
Setting the scene and using scatter graphs
What questions do you have about this photo? Photo credits: Oxfam
What is life like for the women honey producers? Setting the scene
Photo credit: Oxfam Ethiopian woman with her bee hives
Photo credit: Oxfam Women bee keepers working together
Photo credit: Oxfam Ethiopian women at a market
Oxfam ran the Researching Womens Collective Action (WCA) project, launched in 2009, with funding from the Bill and Melinda Gates Foundation. The research gathered evidence on how collective action can improve women smallholders incomes, strengthen their assets and increase their empowerment. Women honey producers in Ethiopia were one group who were part of this project. Photo Credit: Oxfam
Quick Quiz What fraction of the world s working hours are completed by women? A B C 2 3 1 4 1 2
Quick Quiz What fraction of the world s working hours are completed by women?
Quick Quiz What percentage of the world s income do women earn? A B C 10% 30% 50%
Quick Quiz What percentage of the world s income do women earn?
Quick Quiz What percentage of the world s property is owned by women? A B C 0.5% 1% 5%
Quick Quiz What percentage of world s property is owned by women?
Scatter Graphs Wealth Index compared to age in non-WCA members in Ethiopia What does this point represent? Wealth Index What can you say about this person? We call this an outlier. Age
Scatter Graphs Wealth Index compared to age in non-WCA members in Ethiopia Is there a relationship between age and wealth? Wealth Index Age
Scatter Graphs Wealth Index compared to age in non-WCA members in Ethiopia The older a person is, the wealthier they are. Wealth Index This shows a positive correlation. Age
Scatter Graphs Wealth Index compared to age in non-WCA members in Ethiopia A line of best fit does not need to go through the origin (that s just in Science)! The red line is called a line of best fit and should show the trend of the data. Wealth Index Age
Scatter Graphs Wealth Index compared to age in WCA members in Ethiopia There doesn t seem to be a relationship between age and wealth in the WCA members. What might this tell you about the difference the WCA is making in Ethiopia? Wealth Index Age
Scatter Graphs Positive Correlation Negative Correlation No Correlation
Scatter Graphs Correlation Correlation is described as positive , negative or no correlation . Relationship The relationship provides more of an explanation of the trend or pattern seen. E.g. The more education a woman receives, the more money she can earn.
Scatter Graphs Plot your own scatter graph using the data provided. What correlation does your graph show? What is the relationship between the data? Can you use your scatter graph to predict how much product a 50 year old woman might produce? HINT: Use your LOBF.
Scatter Graphs Plenary- Match the words to their definitions. Correlation Best represents the trend of the data An explanation of the how one variable changes with the other Relationship Line of Best Fit Positive, negative or no correlation
Scatter Graphs Look at Learner Worksheet C. What does the graph tell you? Can you draw a line of best fit if you only consider the women who have had some education?