Statistical Comparison Testing in Research
Explore the importance of post hoc or multiple comparison testing in research to identify statistically different group means. Learn about using ANOVA, interpreting results, and making conclusions based on data in various scenarios.

Download Presentation

Please find below an Image/Link to download the presentation.
The content on the website is provided AS IS for your information and personal use only. It may not be sold, licensed, or shared on other websites without obtaining consent from the author. If you encounter any issues during the download, it is possible that the publisher has removed the file from their server.
You are allowed to download the files provided on this website for personal or commercial use, subject to the condition that they are used lawfully. All files are the property of their respective owners.
The content on the website is provided AS IS for your information and personal use only. It may not be sold, licensed, or shared on other websites without obtaining consent from the author.
E N D
Presentation Transcript
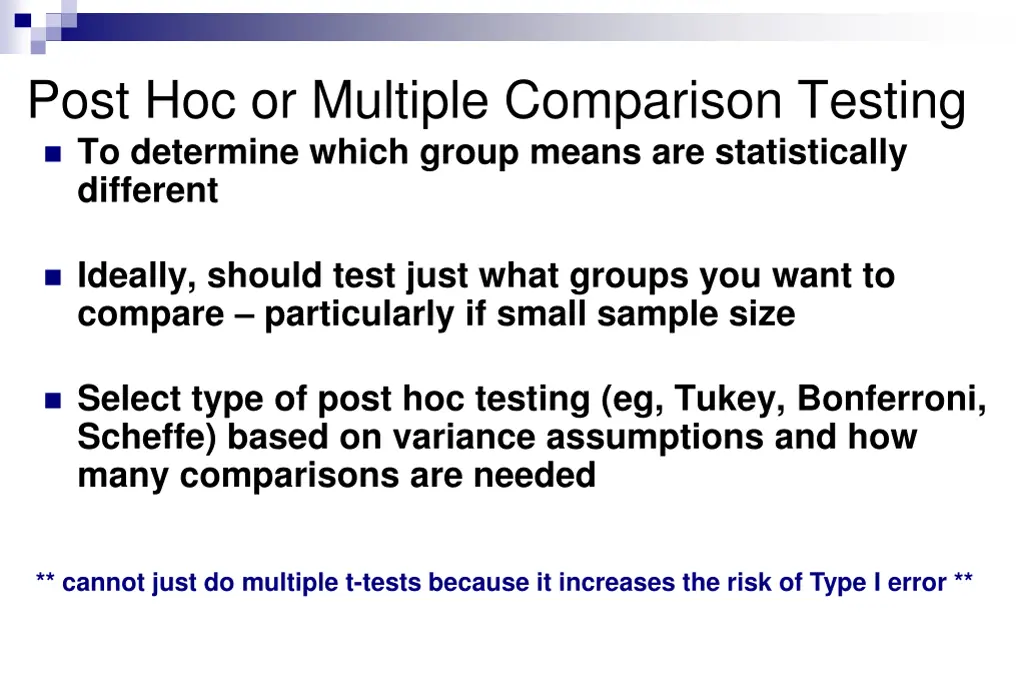
Post Hoc or Multiple Comparison Testing To determine which group means are statistically different Ideally, should test just what groups you want to compare particularly if small sample size Select type of post hoc testing (eg, Tukey, Bonferroni, Scheffe) based on variance assumptions and how many comparisons are needed ** cannot just do multiple t-tests because it increases the risk of Type I error **
Examples: One-Way ANOVA Research Question: Is there a difference in confidence scores among those who are rarely, sometimes or often in a depressed state of mind?
Depression Level N Mean (SD) Confidence Score F-Ratio and p-value Multiple Comparisons Rarely Sometimes Rarely 356 68.89(10.05) F = 111.46 (p=.001) Sometimes 266 58.22(10.83) p = .001 Often 47 46.23(12.50) p = .001 p = .001 Interpretation There is a statistically significant difference in overall confidence score between depression groups F(3, 676) = 111.46, p <.001. The post hoc testing indicated that there was a significant difference in confidence scores between those who were rarely depressed and all of the other groups. The group that is rarely depressed rated their confidence score (mean = 68.89) significantly higher than the sometimes (mean = 58.22) and often (mean = 46.23) groups.
Depression Level N Mean (SD) Confidence Score F-Ratio and p-value Multiple Comparisons Rarely Sometimes Rarely 356 68.89(10.05) 266 58.22(10.83) p = .001 Sometimes F = 111.46 (p=.001) Often 47 46.23(12.50) p = .001 p = .001 Which of the following conclusions can be made based on the above data? A. There is a not a significant difference between the depression levels. B. The sometimes group reported a significantly higher mean confidence score as compared to the often group. C. The sometimes group reported a significantly lower mean confidence score as compared to the often group. D. There is not a significant difference between the mean confidence scores of the rarely and sometimes groups.
Nursing Staff RN LPN UAP N Mean (SD) Job Satisfaction Score 45.0(3.95) 41.7(5.79) 36.2(6.37) F-Ratio and p-value F = 13.23 (p=.001) MultipleComparisons RN LPN 20 20 20 p = .258 p = .024 p = .004 Levene s Test = .526 1.We see that the mean job satisfaction score for the RN group is 45.0 (SD 3.95), the LPN group is 41.7 (SD 5.79) and the UAP group is 36.2 (SD 6.37). 2. Levene s test result=.526 which is not significant because p>.05 so we can assume that there is no significant difference between the variances of the two groups. 3.The next value is the F-ratio which is 13.23 and the p-value corresponding to the F-ratio is .001. Since the p-value is <.05 (p=.001) we can reject the null hypothesis. 4. The next step is to determine where the differences exist among the groups (i.e., RN vs. LPN, RN vs. UAP, LPN vs. UAP). RNs to LPNs the value for p=.258 which is greater than .05, which means it is not significant, and you conclude that there is no difference in the mean job satisfaction scores of RNs vs. LPNs (45.0 and 41.7 respectively). RNs to UAPs the value for p=.024 whichis less than .05, which means it is significant, and you conclude that there is a statistically significant difference in the mean job satisfaction scores of RNs vs. UAPs (45.0 and 36.2) LPNs to UAPs the value for p=.004 which is less than .05, which means it is significant In conclusion, the UAPs are less satisfied than both the RNs and LPNs.