Join Professor Young-Sun Lee for a discussion on statistical inference, single-factor ANOVA, and comparing means of different groups. Explore the mathematics behind Analysis of Variance and understand the concepts of variance comparison between groups. Dive into examples of applying ANOVA in real-world scenarios like evaluating science curricula in schools.
Please find below an Image/Link to download the presentation.
The content on the website is provided AS IS for your information and personal use only. It may not be sold, licensed, or shared on other websites without obtaining consent from the author. If you encounter any issues during the download, it is possible that the publisher has removed the file from their server.
You are allowed to download the files provided on this website for personal or commercial use, subject to the condition that they are used lawfully. All files are the property of their respective owners.
The content on the website is provided AS IS for your information and personal use only. It may not be sold, licensed, or shared on other websites without obtaining consent from the author.
E N D
Presentation Transcript
HUDM4122 Probability and Statistical Inference May 4, 2015
Today We have a special guest Professor Young-Sun Lee If you enjoyed this class, you may enjoy taking HUDM5122: Applied Regression Analysis HUDM6051: Psychometric Theory I HUDM6052: Psychometric Theory II With professor Lee
HW11: Very nice work! Folks struggled with the first problem, but brought it together in the later problems 1 0.9 0.8 0.7 Percent Correct 0.6 Data as of 9:27 pm, 5/3/2015 0.5 0.4 0.3 0.2 0.1 0 1 2 3 4 Problem
HW11: Furthermore, most of the errors on problems 3-4 were minor mathematical errors rather than conceptual errors
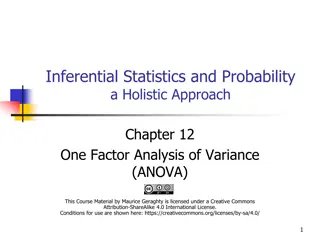
Where we left off We were just getting rolling with discussing the mathematics behind Analysis of Variance (ANOVA) For the single-factor case Comparing a set of several means to each other
Review: Big Idea Compute whether there s a difference between groups By comparing between-group variance to other variance
Review: Single-factor ANOVA H0 : All groups have the same mean Ha : At least one group has a mean that is statistically significantly different than the other means
Example We Were Discussing The Mt. Vernon City School District is considering 5 science curricula Interactive Science Holt Science Spectrum McDougal Littell Science CK-12 Science Bob s Discount Science Curriculum They randomly divide students into five groups, and each classroom uses one curriculum
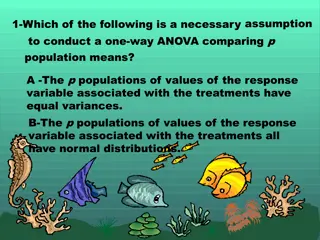
You have k samples from k populations In this case 5 samples from 5 populations With sample means ?1, ?2, ?3, ?4, ?5 And sample standard deviations are close enough to hypothesize that there is a common Is at least one mean higher or lower than the rest?
Review: What we do Take ???, the j-th data point for the i-th sample And take the overall sample mean, ? In that case, we can assess the total variation in the experiment as the total sum of squares
Review: Total Sum of Squares Is made up of two components The sum of squares for treatments (SST) The sum of squares for errors (SSE) Total SS = SST + SSE
Review: Sum of Squares for Treatments (SST) The variance attributable to the difference between treatments SST = ??( ?? ?)2
Review: Sum of Squares for Error (SSE) The pooled variation in the k samples SSE = ?1 1 ?12+ ?2 1 ?22+ + ?? 1 ??2
Once you have Total SS, SST, SSE You can find the degrees of freedom for each And then compute the mean squares Which are used to conduct an ANOVA
Degrees of freedom Degrees of freedom on total SS = (n-1) Based on total data set size, ignoring groups Degrees of freedom on SST = (k-1) Based on number of groups Number of parameters we get from having that many groups Degrees of freedom on SSE = n-k What s left over
Mean squares Degree of variance predicted per degree of freedom MSS = TSS/df(TSS) MST = SST/df(SST) MSE = SSE/df(SSE) MSE is a pooled estimate of The estimated variance across the whole data set, regardless of whether or not H0 is true
Now we can test our null hypothesis H0 : All groups have the same mean Ha : At least one group has a mean that is statistically significantly different than the other means
How do we test it? Well, if H0 is true Then MST = MSE Because the variation between groups will be the same as the variation within all groups together
How do we test it? But if H0 is false Then MST > MSE Because the variation between groups will be bigger than the variation within all groups together
So we can compute F = ??? ??? Where F is a new distribution that we haven t seen before
F Distribution Is the ratio of two distributions F = (df1)/ (df2)
F Distribution And as such, it has two types of degrees of freedom numerator df denominator df F = (df1)/ (df2)
F distribution Numerator degrees of freedom MST degrees of freedom k-1 Denominator degrees of freedom: MSE degrees of freedom n-k
Finding the p value For a given F value, denominator degrees of freedom df (MST), and numerator degrees of freedom df (MSE) You can find the p value using a calculator For example, in Excel =FDIST(F,df(MST),df(MSE) Written F(df(MST),df(MST))=f, p =
Example We Were Discussing The Mt. Vernon City School District is considering 5 science curricula Interactive Science Holt Science Spectrum McDougal Littell Science CK-12 Science Bob s Discount Science Curriculum They randomly divide students into five groups, and each classroom uses one curriculum
Lets Say We Measure Student Attitudes Interactive Science: 3, 4, 5 Holt Science Spectrum: 5, 5, 4 McDougal Littell Science: 4, 4, 5 CK-12 Science: 3, 3, 4 Bob s Discount Science Curriculum: 1, 1, 2
F MST = SST/df(SST) = 21.0667/4 = 5.2667 MSE = SSE/df(SSE) = 4.6667/11 = 0.4242 F = ??? ??? = 5.2667/0.4242 = 12.4143 F(4,11) = 12.4143, p<0.01 So there is an overall difference between groups


2")
2")
2= 25.7333")
2")
2 = 21.0667")