Statistical Intervals and Maximum Likelihood Estimation

This informative content delves into statistical intervals such as confidence intervals, credible intervals, and high-density intervals. It also explains the concept of maximum likelihood estimation using models like the binomial distribution. The material further explores Clopper-Pearson confidence intervals and Bayesian equivalents of confidence intervals, providing insights into posterior probability density functions. Additionally, it discusses the difference between the two intervals and presents a Bayesian analysis scenario.

Download Presentation

Please find below an Image/Link to download the presentation.
The content on the website is provided AS IS for your information and personal use only. It may not be sold, licensed, or shared on other websites without obtaining consent from the author.If you encounter any issues during the download, it is possible that the publisher has removed the file from their server.
You are allowed to download the files provided on this website for personal or commercial use, subject to the condition that they are used lawfully. All files are the property of their respective owners.
The content on the website is provided AS IS for your information and personal use only. It may not be sold, licensed, or shared on other websites without obtaining consent from the author.
E N D
Presentation Transcript
Confidence interval, credible interval and high density interval Xuhua Xia xxia@uottawa.ca http://dambe.bio.uottawa.ca
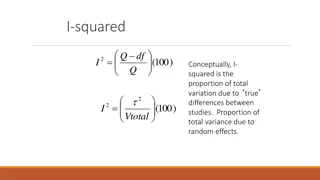
Maximum likelihood illustration The likelihood approach always needs a model. As a fish is either a male or a female, we use the model of binomial distribution, and the likelihood function is ! ( | , ) !( M N M N = = M N M (1 ) . L p M N p p p )! The maximum likelihood method finds the value of p that maximizes the likelihood value. This maximization process is simplified by maximizing the natural logarithm of L instead: ln ln( ) ( L A M p N = + + )ln(1 ) M p ln L M N M = = 0 1 p p p M = . p N The likelihood estimate of the variance of p is the negative reciprocal of the second derivative, 1 1 ( ) ln( ) (1 p p p (1 ) p p = = = . Var p M N M 2 L N 2 2 ) 2 Slide 2 Xuhua Xia
Clopper-Pearson confidence interval 1 1 (1 ) p p ? = = = ( ) . Var p M N M 2 ln( ) L N 2 2 (1 ) p p 2 p Most frequently used confidence interval for proportions ? ?? = ? + ? ? + 1 ?? 2 ,?1,?2;?1 = 2 ? ? 1 ;?2 = 2? ? + 1 ?? 2 ,?1 ? ? + (? + 1)?? 2 ,?1 ,?2 = ?2+ 2;?2 = ?1 2 ?? = ;?1 ,?2 3.5 6 Likelihood 3 5 Posterior 2.5 4 Likelihood 2 f(p) 3 1.5 Prior 2 1 1 0.5 0 0 0.45 0.01 0.05 0.09 0.13 0.17 0.21 0.25 0.29 0.33 0.37 0.41 0.49 0.53 0.57 0.61 0.65 0.69 0.73 0.77 0.81 0.85 0.89 0.93 0.97 p
R code for CP confidence interval CP95 <- function(X,n) { if(X==0) LL = 0 else { v1<-2*(n-X+1); v2<-2*X LL<-X/(X+(n-X+1)*qf(0.025,v1,v2,lower.tail=FALSE)) } if (X==n) UL = 1 else { u1=v2+2; u2=v1-2 Finv<-qf(0.025,u1,u2,lower.tail=FALSE) UL <-(X+1)*Finv / (n -X+(X+1)*Finv) } return(c(LL, UL)) } CP95(5,30) # will output 0.0564217 and 0.3472117 Slide 4
Bayesian equivalents of C.I. Posterior probability density function known Credible interval (exact) High density interval (exact) Posterior probability density function unknown Credible interval (approximate) High density interval (approximate) Slide 5
Difference between the two intervals 0.4822 0.9398 3 2.5 2 density 1.5 1 0.959 0.5 0.517 0 0.1 0.2 0.3 0.4 0.5 0.6 0.7 0.8 0.9 1 p
The posterior ( | f y p f p ) ( ) = ( | ) f p y ( | f y p f p dp ) ( ) 8 2 30 (1 ) A B p p 8 2 = = = ( | ) f p y 495 (1 ) p p 2/33 3.5 6 Likelihood 3 5 Posterior 2.5 4 Likelihood 2 f(p) 3 1.5 Prior 2 1 1 0.5 0 0 0.45 0.01 0.05 0.09 0.13 0.17 0.21 0.25 0.29 0.33 0.37 0.41 0.49 0.53 0.57 0.61 0.65 0.69 0.73 0.77 0.81 0.85 0.89 0.93 0.97 Slide 7 Xuhua Xia p
MCMC: Metropolis N <- 50000 z <- sample(1:10000,N,replace=T)/20000 meanz <- mean(z) rnd <- sample(1:10000,N,replace=T)/10000 p <- rep(0,N) p[1] <- 0.1 # or just any number between 0 and 1 Add=TRUE for (i in seq(1:(N-1))) { p[i+1] <- p[i] + (if(Add) z[i] else -z[i]) if(p[i+1]>1) { p[i+1] <- p[i]-z[i] } else if(p[i+1]<0) { p[i+1] <- p[i]+z[i] } fp0 <- dbeta(p[i],3,3) fp1 <- dbeta(p[i+1],3,3) L0 <- p[i]^6 L1 <- p[i+1]^6 numer <- (fp1*L1) denom <- (fp0*L0) if(numer>denom) { if(p[i+1]>p[i]) Add=TRUE else Add=FALSE } else { if(p[i+1]>p[i]) Add=FALSE else Add=TRUE Alpha <- numer/denom # Alpha is (0,1) if(rnd[i] > Alpha) { p[i+1] <- p[i] p[i] <- 0 } } } postp <- p[(N-9999):N] postp <- postp[postp>0] freq <- hist(postp) mean(postp) sd(postp) Run with = 3 and = 3 Run again with = 1, = 1 Slide 8 Xuhua Xia
Posterior PDF known # Credible interval qbeta(c(0.025,0.975),9,3) # generates 0.4822441, 0.9397823 # High density interval p<-seq(0,1,by=0.001) # reduce 'by' value to increase precision db<-dbeta(p,9,3) # get corresponding prob. density sb<-sample(db,1e5,replace=TRUE,prob=db) # sample prob. density critVal <- quantile(sb, 0.05) # a value to horizontally cut the peak phigh <-p[db >= critVal] lo<-phigh[1] hi<-phigh[length(phigh)] lo;hi # display lo = 0.517 and hi = 0.959. Slide 9
Approximate posterior PDF 2.5% 0.4745 97.5% 0.9455 3.5 3 2.5 Density 2 1.5 1 0.5 0 0.25 0.35 0.45 0.55 0.65 0.75 0.85 0.95 p dx Edx
Posterior PDF unknown # Quick and dirty credible interval quantile(postp,c(0.025,0.975)) # generates credible interval # More refined method res<-hist(postp,100) x<-res$mids; dx<-res$density fit25<-loess(dx~x,span=0.25) # higher span leads to more smooth fit p<-seq(min(x),max(x),by=0.001) # reduce 'by' value to increase precision dp<-pmax(0,predict(fit25,data.frame(x=p))) # pmax changes all negative values to 0. samp<-sample(p,1e5,replace=TRUE,prob=dp) quantile(samp,c(0.025,0.975)) # produce credible interval samp <- sample(dp, 1e5, replace = TRUE, prob = dp) # sample probability densities crit <- quantile(samp, 0.05) # a horizontal line to cut the peak phigh <-p[dp >= crit] lo<-phigh[1]; hi<-phigh[length(phigh)] lo; hi # produce high density interval Slide 11