Statistics Concepts in Business Analysis
Explore key concepts in statistics such as normal distribution, probability calculations, confidence intervals, regression analysis, point estimates, PMCC, and reliability of regression relationships through practical examples and analysis.

Download Presentation

Please find below an Image/Link to download the presentation.
The content on the website is provided AS IS for your information and personal use only. It may not be sold, licensed, or shared on other websites without obtaining consent from the author.If you encounter any issues during the download, it is possible that the publisher has removed the file from their server.
You are allowed to download the files provided on this website for personal or commercial use, subject to the condition that they are used lawfully. All files are the property of their respective owners.
The content on the website is provided AS IS for your information and personal use only. It may not be sold, licensed, or shared on other websites without obtaining consent from the author.
E N D
Presentation Transcript
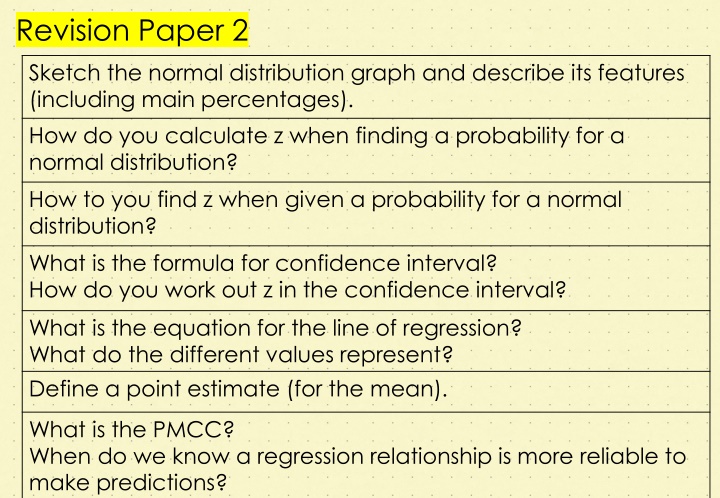
Revision Paper 2 Sketch the normal distribution graph and describe its features (including main percentages). How do you calculate z when finding a probability for a normal distribution? How to you find z when given a probability for a normal distribution? What is the formula for confidence interval? How do you work out z in the confidence interval? What is the equation for the line of regression? What do the different values represent? Define a point estimate (for the mean). What is the PMCC? When do we know a regression relationship is more reliable to make predictions?
Paper 2 Paper 2 3.4 Critical analysis of given data and models (including preliminary material) 3.5 The normal distribution 3.6 and related probabilities and estimation; confidence intervals 3.7 Correlation and regression
Phillip says that Amazon weekly users are more than double Apple weekly users. Is he correct. Justify your answer.
Phillip says that Amazon weekly users are more than double Apple weekly users. Is he correct. Justify your answer. Amazon have 24% of consumers more than double Apple s 10% of consumers, so correct.
From a standard subscription of 9.99, what is the maximum VAT the Government could receive from Apple music?
From a standard subscription of 9.99, what is the maximum VAT the Government could receive from Apple music? 0.255 22.6 1.67 = 9.62 million
What percentage of the royalty pot (after VAT) does the record label receive according to this diagram.
What percentage of the royalty pot (after VAT) does the record label receive according to this diagram. Record label keeps 70% of the 55% = 38.5% of royalty pot.
Quizizz Normal Distribution and Confidence Intervals
ND and CI Basic Questions A random variable X is normally distributed with mean 10 and standard deviation 2. Calculate the probability that X is greater than 11.4. A random variable X is normal distributed with mean 9.9 and standard deviation 1.7. Calculate the probability that X is between 13.1 and 8. A random variable X is normal distributed with mean 6 and standard deviation 0.7. The probability that x is less than a value is 32%. What is this value? In a sample of 100 items, the mean is and standard deviation is 0.3. The total value of these items is 300. Construct a 92% confidence interval for in the form [ , ]
Correlation and Regression Quizizz
C & R Basic Questions Find the Product Moment Correlation Coefficient for the following data: x: 4 11 20 11 26 32 33 49 51 X 58 y: 14 22 21 25 26 25 30 47 X 55 50 Find the equation for the line of regression of y on x for the above data. Find values to plot this line. Another x value is given as 51. Use the line of regression to predict the y value. Another x value is given as 55. Use the line of regression to predict the y value. Comment on these predictions Another set of data is generated. Is y or z more reliable to predict x? Explain why. x: 4 11 20 11 26 32 33 49 X 58 z: 21 23 25 23 27 36 46 44 25 65
In an investigation into smoking, 8 patients were assessed for the amount of lung damage (y) they had suffered after how many years they had been smoking (x). The mean speed of a sample of 20 vehicles on a road is 62.5mph with a variance of 32 mph. a) Calculate a 94% confidence interval for the mean of all the vehicles on the road. Years smoked (x) 16 18 14 19 22 13 17 25 b) It is claimed that the mean speed of vehicles on this road is above the speed limit of 60mph. Comment on this claim. Lung damage (y) 42 56 32 76 83 44 58 80 a) Describe the correlation between the years smoked and lung damage. b) By finding the equation of regression, predict how much lung damage someone who has smoked for 20 years could expect. c) Amelia has been smoking for 4 years. She claims that she will not have any lung damage after 4 years. Comment on her claim. A long-life LED bulb has a mean life of 50000 hours and a standard deviation of 6000 hours. a) Work out the probability a bulb chosen at random will last: i) more than 60000 hours ii) Between 45000 and 60000 hours Samples of leaves were collected from 4 different oak trees and their mean length recorded. They are shown in the following table: Sample size Mean length (cm) 15 8.9cm b) The manufacturing company want to advertise that 90% of their bulbs last for more than a given number of hours. How many hours should 90% of their bulbs last more than? 25 10.5cm 30 9.7cm c) In a sample of bulbs, 14 bulbs lasted for less than 40000 hours. Estimate how many bulbs were in the sample (to the nearest 10). 50 10.2cm a) Estimate the best possible point estimate of the mean of the population. b) Explain how the accuracy of the estimate of the population mean could be improved.
Starter Questions Normal Distribution and Confidence Intervals 1) A random variable X is normally distributed with mean 10 and standard deviation 2. Calculate the probability that X is greater than 11.4. 1) Sketch the normal distribution graph and describe its features (including main percentages). 2) How do you calculate z when finding a probability for a normal distribution? 2) A random variable X is normal distributed with mean 9.9 and standard deviation 1.7. Calculate the probability that X is between 13.1 and 8. 3) How to you find z when given a probability for a normal distribution? 3) A random variable X is normal distributed with mean 6 and standard deviation 0.7. The probability that x is less than a value is 32%. What is this value? 4) What is the formula for confidence interval? 5) How do you work out z in the confidence interval? 6) What is the equation for the line of regression? 4) In a sample of 100 items, the mean is and standard deviation is 0.3. The total value of these items is 300. Construct a 92% confidence interval for in the form [ , ] 7) What do the different values represent? 8) Define a point estimate (for the mean). 9) What is the PMCC? 10)When do we know a regression relationship is more reliable to make predictions? Preliminary Material Correlation and Regression 1) Find the Product Moment Correlation Coefficient for the following data: x: 4 11 20 11 26 32 33 49 51 X 58 y: 14 22 21 25 26 25 30 47 X 55 50 1) Phillip says that Amazon weekly users are more than double Apple weekly users. Is he correct. Justify your answer. 2) From a standard subscription of 9.99, what is the maximum VAT the Government could receive from Apple music? 2) Find the equation for the line of regression of y on x for the above data. Find values to plot this line. 3) What percentage of the royalty pot (after VAT) does the record label receive according to this diagram. 3) Another x value is given as 51. Use the line of regression to predict the y value. 4) Another x value is given as 55. Use the line of regression to predict the y value. 5) Comment on these predictions 6) Another set of data is generated. Is y or z more reliable to predict x? Explain why. x: 4 11 20 11 26 32 33 49 X 58 z: 21 23 25 23 27 36 46 44 25 65
Find the Product Moment Correlation Coefficient for the following data: x: 4 11 20 11 26 32 33 49 51 X 58 y: 14 22 21 25 26 25 30 47 X 55 50 Find the equation for the line of regression of y on x for the above data. Find values to plot this line. Another x value is given as 51. Use the line of regression to predict the y value. Another x value is given as 55. Use the line of regression to predict the y value. Comment on these predictions Another set of data is generated. Is y or z more reliable to predict x? Explain why. x: 4 11 20 11 26 32 33 49 X 58 z: 21 23 25 23 27 36 46 44 25 65
In an investigation into smoking, 8 patients were assessed for the amount of lung damage (y) they had suffered after how many years they had been smoking (x). The mean speed of a sample of 20 vehicles on a road is 62.5mph with a variance of 32 mph. a) Calculate a 94% confidence interval for the mean of all the vehicles on the road. Years smoked (x) 16 18 14 19 22 13 17 25 b) It is claimed that the mean speed of vehicles on this road is above the speed limit of 60mph. Comment on this claim. Lung damage (y) 42 56 32 76 83 44 58 80 a) Describe the correlation between the years smoked and lung damage. b) By finding the equation of regression, predict how much lung damage someone who has smoked for 20 years could expect. c) Amelia has been smoking for 4 years. She claims that she will not have any lung damage after 4 years. Comment on her claim. A long-life LED bulb has a mean life of 50000 hours and a standard deviation of 6000 hours. a) Work out the probability a bulb chosen at random will last: i) more than 60000 hours ii) Between 45000 and 60000 hours Samples of leaves were collected from 4 different oak trees and their mean length recorded. They are shown in the following table: Sample size Mean length (cm) 15 8.9cm b) The manufacturing company want to advertise that 90% of their bulbs last for more than a given number of hours. How many hours should 90% of their bulbs last more than? 25 10.5cm 30 9.7cm c) In a sample of bulbs, 14 bulbs lasted for less than 40000 hours. Estimate how many bulbs were in the sample (to the nearest 10). 50 10.2cm a) Estimate the best possible point estimate of the mean of the population. b) Explain how the accuracy of the estimate of the population mean could be improved.


 does")
 does")