Statistics Sampling Methods Overview
Understand the basic principles of statistical sampling methods such as simple random sampling, stratified sampling, and systematic sampling. Learn how to select samples using randomization techniques and explore different types of data including numerical and categorical data.

Download Presentation

Please find below an Image/Link to download the presentation.
The content on the website is provided AS IS for your information and personal use only. It may not be sold, licensed, or shared on other websites without obtaining consent from the author. If you encounter any issues during the download, it is possible that the publisher has removed the file from their server.
You are allowed to download the files provided on this website for personal or commercial use, subject to the condition that they are used lawfully. All files are the property of their respective owners.
The content on the website is provided AS IS for your information and personal use only. It may not be sold, licensed, or shared on other websites without obtaining consent from the author.
E N D
Presentation Transcript
Sampling methods AP Statistics Chapter 12
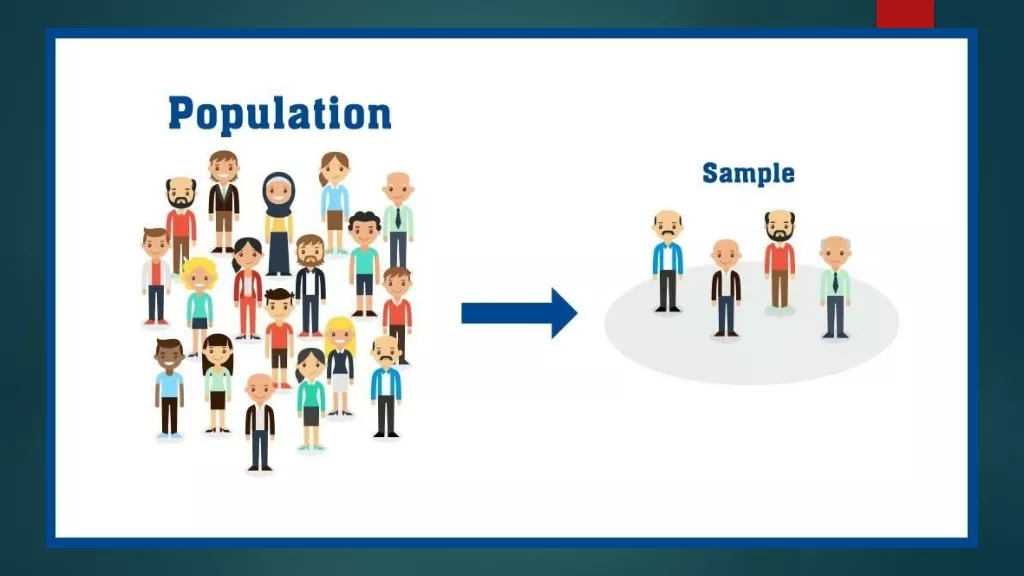
Random Sampling All statistical sampling designs have in common the idea that chance not human choice is used to select the sample.
Randomize let chance do the choosing! Randomization can protect you against -factors that you know are in the data -factors you are not even aware of Randomizing makes sure that on the average the sample looks like the population.
Summary of Sampling Methods Simple Random Sampling every individual has an equal chance of being selected every set of nindividuals has an equal chance of being selected *most basic & fundamental type of sampling!
Summary of Sampling Methods Stratified Sampling divide population into strata (homogenous layers, subpopulations) take SRS from each strata Cluster sampling divide population into clusters (each cluster should be representative of population) Randomly select one (or more) cluster(s) Take a CENSUS of the selected cluster(s)
Summary of Sampling Methods Systematic Sampling Randomly select a starting point, then take (for example) every 10th (or 20th, or 5th, etc.) subject... Multistage Sampling Randomness is involved at more than one stage Be careful not to confuse with CLUSTER sampling
Describe how to select a SRS of 5 students from a group of 27: Assign each student a unique number from 1 27 Use a RNG (on a calculator/computer) to generate 5 UNIQUE numbers from that range (repeated numbers will be ignored). The 5 students who have their numbers drawn will OR Assign each student a unique number from 1 27 Write the numbers 1 27 on slips of paper, and put them in a hat. Stir the slips to mix them. Without looking, draw 5 slips of paper from the hat WITHOUT REPLACEMENT. The 5 students who have their numbers drawn will
Types of data Numerical vs Categorical Numerical: Does it make sense to take an average? Catergorical: Cannot take an average, but we CAN take a proportion (or percentage) of Name Job Type Age Gender Race Salary Zip Code Jose Cedillo Technical 27 Male Hispanic 52,300 90630 Amanda Childers Clerical 42 Female White 27,500 90521 Tonia Chen Management 51 Female Asian 83,600 90629
A research group wishes to know the mean GPA of all 2600(ish) students at Podunk High School. To estimate this, they take a random sample of 189 students that are enrolled in Pre-AP/AP math classes, and pull those records. The mean GPA of the students in the sample is 3.38. According to the school registrar, the GPA of all 2600(ish) students at Podunk High School is 3.09. Identify the following (WHO are we interested in?) ALL students at PHS a) Population (of interest): (WHAT are we interested in?) Mean GPA of ALL students at PHS b) Parameter of interest: (who had a CHANCE of being selected?) All students enrolled in Pre-AP/AP Math c) Sampling frame: (who was actually selected?) The 189 students. d) Sample: GPA is numerical data: 3.09 this number is the PARAMETER (refers to the population) 3.38 this number is the STATISTIC (refers to the sample)
A neighborhood interest group wants to know what proportion of households in Austin watch the TV show Dancing with the Comets. They select a random sample of 59 houses from Northwest Austin, and find that 35.6% of those families watch the program regularly. Local ratings indicate that about 22% of all households watch Dancing with the Comets on a regular basis. Identify the following Households in Austin (probably ALL of Austin) a) Population (of interest): What proportion of households in Austin watch DWTC b) Parameter of interest: c) Sampling frame: Households in Northwest Austin d) Sample: This is categorical data (think: The answer is Yes/No. 22% or 0.22 this number is the PARAMETER (refers to the population) 35.6% or 0.356 this number is the STATISTIC (refers to the sample) The 59 houses that were selected.