Stock Market Insights and Analysis
Explore historical data and insights on corporate profits, equity investments, and Nifty returns. Gain valuable information on market trends, speculator statistics, and the importance of understanding stock market dynamics for successful trading strategies.

Download Presentation

Please find below an Image/Link to download the presentation.
The content on the website is provided AS IS for your information and personal use only. It may not be sold, licensed, or shared on other websites without obtaining consent from the author. If you encounter any issues during the download, it is possible that the publisher has removed the file from their server.
You are allowed to download the files provided on this website for personal or commercial use, subject to the condition that they are used lawfully. All files are the property of their respective owners.
The content on the website is provided AS IS for your information and personal use only. It may not be sold, licensed, or shared on other websites without obtaining consent from the author.
E N D
Presentation Transcript
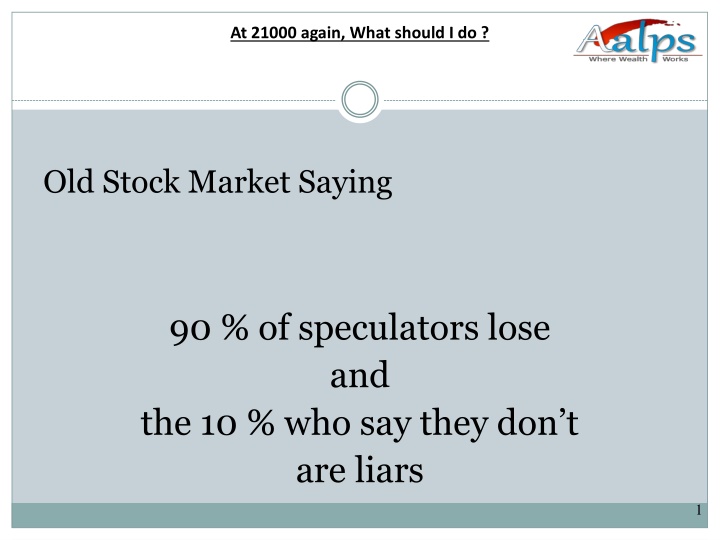
At 21000 again, What should I do ? Old Stock Market Saying 90 % of speculators lose and the 10 % who say they don t are liars 1
Corporate profits after Tax RELAINCE INDUSTRIES ONGC SBI TCS NTPC INFOSYS BHARTI AIRTEL TATA STEEL ICICI BANK BHEL HDFC BANK BANK OF BARODA ITC SAIL PUNJAB NATIONAL BANK WIPRO COAL INDIA AXIS BANK HDFC L&T GAIL HIDALCO BAJAJ AUTO POWER GRID CORPORATION HUL As on Mar '12 20040.00 18924.00 11707.29 10975.98 9102.59 8470.00 7716.90 6865.69 6465.26 As on Mar '07 11943.40 14430.78 4541.31 2716.87 5820.20 3783.00 2012.08 3506.38 3110.22 1679.16 1382.54 1026.00 2235.35 4012.97 1439.31 2483.89 1711.66 Corporate profits after Tax As on Mar '12 MARUTI SUZUKI JINDAL STEEL HERO MOTO CORP TATA MOTORS SESA GOA BPCL STERLITE INDUSTRIES SUN PHARMA ACC IDFC DLF AMBUJA CEMENT GRASIM As on Mar '07 2288.60 2064.12 1927.90 1811.82 1679.94 1546.68 1419.71 1383.80 1325.26 1277.15 1269.58 1228.86 1181.71 1167.78 1085.05 1080.91 960.39 958.39 941.49 893.40 845.43 463.11 177.23 -212.67 -3052.05 1189.10 572.94 1381.98 1528.88 606.41 291.65 511.12 461.29 1231.84 375.64 227.44 1503.25 863.21 639.99 118.23 650.34 607.64 187.81 610.54 912.40 365.86 108.27 638.38 0.00 380.54 6011.20 5167.09 5006.96 4987.61 4904.74 4884.20 4843.70 4723.56 4242.21 4122.62 3957.89 3561.13 3559.44 3339.73 2696.89 2305.97 JAIPRAKASH ASSOCIATES KOTAK BANK RELIANCE INFRASTRUCTURE CIPLA ASIAN PAINTS TATA POWER DR.REDDY LABS SIEMENS MAHINDRA & MAHINDRA HCL TECH CAIRN INDIA RANBAXY LAB 659.03 1570.38 1012.14 2310.07 1655.55 1101.63 1008.93 1855.37 194296.24 94972.97 Total
Equity Investment : Historical Nifty, BSE Nifty PE Nifty (BSE) Date BSE PE 31-Dec-07 6138.60 20286.99 27.62 31-Dec-10 6134.50 20509.09 24.48 31-Jan-13 6034.75 19894.98 18.50
Nifty Data from 1st Jan 1999 to Dec 2012 1 year Retuns analysis PE 22-26 23.48 -13.62% 340 472 72.03% Particulars Average Trailings P/E Average Returns Days of negative 1 year returns Total No of returns observed( from Jan 1999) Negative returns as of percentage of Total days PE 10-14 12.93 58.65% 5 421 1.19% PE 14-18 15.68 29.84% 219 1018 21.51% PE 18-22 20.16% 6.39% 459 1127 40.73% PE Above 26 27.07 -33.37% 65 65 100% 3 year Retuns analysis PE 22-26 23.76 -3.97% 113 204 55.39% Particulars Average Trailings P/E Average Returns Days of negative 3 year returns Total No of returns observed( from Jan 1999) Negative returns as of percentage of Total days PE 10-14 12.93 31.37% 0 421 0.00% PE 14-18 15.68 22.73% 56 1018 5.50% PE 18-22 20.00% 7.71% 209 897 23.30% PE Above 26 27.07 -9.12% 58 65 89% 5 year Retuns analysis PE 22-26 23.6 7.80% 0 122 0.00% Particulars Average Trailings P/E Average Returns Days of negative 5 year returns Total No of returns observed( from Jan 1999) Negative returns as of percentage of Total days PE 10-14 12.97 26.44% 0 318 0.00% PE 14-18 15.62 23.56% 0 946 0.00% PE 18-22 19.97% 10.53% 0 675 0.00% PE Above 26 26.92 4.12% 0 39 0%
5 Thank You


![Download Book [PDF] From This Moment: Special Edition Paperback (After We Fall](/thumb/42280/download-book-pdf-from-this-moment-special-edition-paperback-after-we-fall.jpg)
![READ [PDF] Fallen King (Moon Lake Protectors)](/thumb/42281/read-pdf-fallen-king-moon-lake-protectors.jpg)