Learn how to interpret stock quotes, understand components like bid/ask prices, trading volume, dividend info, and more, essential for smart investing decisions in the stock market.
Please find below an Image/Link to download the presentation.
The content on the website is provided AS IS for your information and personal use only. It may not be sold, licensed, or shared on other websites without obtaining consent from the author. If you encounter any issues during the download, it is possible that the publisher has removed the file from their server.
You are allowed to download the files provided on this website for personal or commercial use, subject to the condition that they are used lawfully. All files are the property of their respective owners.
The content on the website is provided AS IS for your information and personal use only. It may not be sold, licensed, or shared on other websites without obtaining consent from the author.
Stock Quote 101 What is it? A stock quote represents the last price at which a seller and a buyer of a stock agreed on a price to make the trade. Because stock prices are determined by a continuous auction process between buyers and sellers, stock prices change frequently as the buyers and sellers change. When you use it? You can use a stock quote when you are buying or selling a stock. It is an easy way to get a lot of information before making a financial decision.
Parts of a Basic Quote Day s Change (how much the stock price changed in the last trading day) Bid/Ask price (how much buyers and sellers in the real market are willing to pay for this stock) Time Stamp (when this quote was issued) Volume (how many shares of this stock traded so far today, or the last trading day)
Parts of a Stock Quote Stock Chart The stock chart can show you how the price of the stock has changed over various time periods. Dividend Info Companies that are consistently profitable give their shareholders dividends. The chart shows how much they pay in dividends and how often. Bid and Ask Price The Bid Price is the highest price a buyer is willing to pay for the stock; the Ask Price is the lowest price a seller is willing to sell the stock.
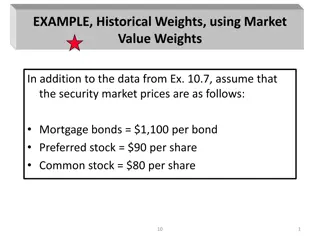
Stock Quote Components Columns 1 & 2: 52-Week High and Low These are the high and low prices a stock was traded over the prior 52 weeks (one year period). Column 3: Company Name & Type of Stock This column provides the name of the stock s company. If the name does not have special symbols or letters, it is common stock. Different special symbols imply different classes of shares. Column 4: Ticker Symbol A stock symbol or ticker symbol is an abbreviation used to uniquely identify publicly traded shares of a specific company s stock on a particular stock market/exchange
Stock Quote Components Column 5: Dividend Per Share This indicates the amount of money that a company pays per share. If it is blank, the company does not pay dividends to its stockholders. Column 6: Dividend Yield The percentage return to the stock owners in dividend per year. You can calculate it by dividing the annual dividends per share by the price per share. Column 7: Price/Earnings Ratio You can calculate this by dividing the stock price by current earnings per share from the last year. This is also called a P/E Ratio.
Stock Quote Components Column 8: Trading Volume This is the total number of shares traded for a specific day, listed in hundreds. Of course you can figure the actual number traded by adding 00 to the end of the number. Column 9 & 10: Day High and Low This shows the daily highest price and lowest price that someone paid for the stock. Column 11: Close The close is the last trading price when the market closes. If the entire listing is BOLDED, then the price is UP or DOWN more than 5% from the prior day s closing price. Column 12: Net Change This is the change in value for the stock price since the previous day s closing price. When you hear that a stock is up for the day, it means that the price increased for the day.