Strategic Alignment and Value Assessment for Project Business Case
Explore the importance of strategic alignment and value assessment in creating a robust project business case. Understand how these factors influence project prioritization and decision-making within organizations.

Download Presentation

Please find below an Image/Link to download the presentation.
The content on the website is provided AS IS for your information and personal use only. It may not be sold, licensed, or shared on other websites without obtaining consent from the author. If you encounter any issues during the download, it is possible that the publisher has removed the file from their server.
You are allowed to download the files provided on this website for personal or commercial use, subject to the condition that they are used lawfully. All files are the property of their respective owners.
The content on the website is provided AS IS for your information and personal use only. It may not be sold, licensed, or shared on other websites without obtaining consent from the author.
E N D
Presentation Transcript
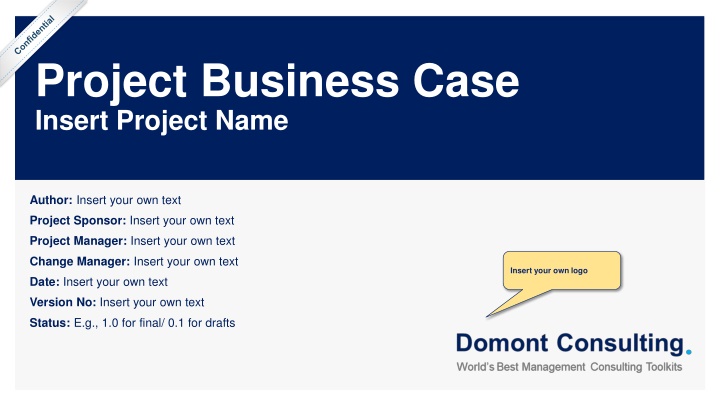
Project Business Case Insert Project Name Author: Insert your own text Project Sponsor: Insert your own text Project Manager: Insert your own text Change Manager: Insert your own text Insert your own logo Date: Insert your own text Version No: Insert your own text Status: E.g., 1.0 for final/ 0.1 for drafts
Guide You can use this deliverable directly for your own purposes. You simply need to insert your logo and adjust the slides based on the specificities of your organization. Please note that this document also includes many slides with best practices, tutorials and real-life examples to help you adjust this deliverable based on the specificities of your organization. These slides have an orange rectangle in the top-right corner. You may decide to delete these slides as they are mainly there to help you fill in the rest of the deliverable. Before you do, copy and paste this document so you always have the original version in case you need it. 2
Purpose A Project Business Case should be created for each potential project. Each Project Business Case will answer the following 3 key questions: Is there a strategic alignment between the project and the corporate and business strategy? If the answer to this question is No , then there is no point answering the following 2 questions, as the project will have to be rejected. How much value will the project create? How easy it will be to implement the project? The answer to these 3 questions will help us rate the project and position it on our Prioritization Matrix. The Prioritization Matrix will help us decide: If our organization should invest in this project. If this project should be a priority 1 , a priority 2 or a priority 3 project. Priority 1 projects should be implemented in the short term, priority 2 projects should be implemented in the mid-term, and priority 3 projects should be implemented in the long term. 3
Document Audience Insert name (insert role) Insert name (insert role) Insert name (insert role) Insert name (insert role) Insert name (insert role) Insert name (insert role) 4
Real-life example Document Audience John Doe (CEO) Raphael Mina (Chief Financial Officer) Conor Kriev (Chief Operating Officer) Patrick Ruffin (Project Sponsor) Sean Macki (Program Manager) 5
Lean Business Case Project name: Project description: Yes No Strategic Alignment Net Present Value $16.3M Ease of implementation Value Low Medium High Difficult Intermediate Easy Project Sponsor John Doe Project Manager John Doe Change Manager John Doe 6
Tutorial Lean Business Case Project name: Project description: This Lean Business Case is a summary of your business case. It is very important, as your CEO and senior executives may not have time to deep dive into more details. Yes No Strategic Alignment Net Present Value $16.3M Ease of implementation Value Low Medium High Difficult Intermediate Easy Project Sponsor John Doe Project Manager John Doe Change Manager John Doe 7
Project Prioritization Prioritization matrix Priority 3 Projects (Actively work to ease the implementation) Priority 2 Projects Priority 1 Projects High Project XYZ Unattractive initiatives (do not pursue) Priority 3 Projects (pursue opportunistically) Priority 2 Projects Value Medium Unattractive initiatives (do not pursue) Unattractive initiatives (do not pursue) Priority 3 Projects (pursue opportunistically) Low Difficult Intermediate Easy Ease of implementation 8
Additional Template Project Prioritization Priority 1 Projects Priority 2 Projects Priority 3 Projects Unattractive Projects Caption: Prioritization matrix High Project XYZ Value Medium Low Difficult Intermediate Easy Ease of implementation 9
Additional Template Project Prioritization Priority 1 Projects Priority 2 Projects Priority 3 Projects Unattractive Projects Caption: Prioritization matrix Project XYZ High Value Medium Low Difficult Intermediate Easy Ease of implementation 10
Project Business Case Framework Project Description Project Assessment 1.Business opportunity & suggested solution 5.Strategic Alignment 2.Project objectives and key performance indicators (KPIs) 3.Project scope, approach and high-level plan 7.Ease of Implementation 6.Value 4.Deliverables, activities & key success factors 11
Table of Contents Project Description Project Assessment 1.Business opportunity & suggested solution 5.Strategic Alignment 2.Project objectives and key performance indicators (KPIs) 3.Project scope, approach and high-level plan 7.Ease of Implementation 6.Value 4.Deliverables, activities & key success factors 12
Business Opportunity & Suggested Solution Replace this text with the key takeaway from this slide Business Opportunity Suggested Solution Describe in this text block the main business opportunity that you have identified Describe in this text block the solution you suggest 13
Best practices Business Opportunity & Suggested Solution Replace this text with the key takeaway from this slide For some projects, you may need more than one slide to express the business opportunity and suggested solution. However, we recommend that you get straight to the point Business Opportunity Suggested Solution Describe in this text block the main business opportunity that you have identified Describe in this text block the solution you suggest 14
Table of Contents Project Description Project Assessment 1.Business opportunity & suggested solution 5.Strategic Alignment 2.Project objectives and key performance indicators (KPIs) 3.Project scope, approach and high-level plan 7.Ease of Implementation 6.Value 4.Deliverables, activities & key success factors 15
Project objectives and key performance indicators (KPIs) Project Objectives Key Performance Indicators Targets Insert project objective Insert Key Performance Indicator Insert target Insert project objective Insert Key Performance Indicator Insert target Insert project objective Insert Key Performance Indicator Insert target Insert project objective Insert Key Performance Indicator Insert target Insert project objective Insert Key Performance Indicator Insert target 16
Real-life example Project objectives and key performance indicators (KPIs) Project Objectives Key Performance Indicators Targets +20% (From $500 to $600) Increase revenue per customer Revenue per customer Increase customer satisfaction Increase Net Promoter Score (NPS) From 80% to 86% Insert project objective Insert Key Performance Indicator Insert target Insert project objective Insert Key Performance Indicator Insert target Insert project objective Insert Key Performance Indicator Insert target 17
Table of Contents Project Description Project Assessment 1.Business opportunity & suggested solution 5.Strategic Alignment 2.Project objectives and key performance indicators (KPIs) 3.Project scope, approach and high-level plan 7.Ease of Implementation 6.Value 4.Deliverables, activities & key success factors 18
Project Scope Category In scope Out of scope Insert your own description Insert your own description Strategy Insert your own description Insert your own description Products Insert your own description Insert your own description Processes Insert your own description Insert your own description Systems Insert your own description Insert your own description Channels Insert your own description Insert your own description Roles Insert your own description Insert your own description Insert category name 19
Tutorial Project Scope The categories may vary a lot depending on your business. Category In scope Out of scope Insert your own description Insert your own description Strategy Insert your own description Insert your own description Products Insert your own description Insert your own description Processes Insert your own description Insert your own description Systems Insert your own description Insert your own description Channels Insert your own description Insert your own description Roles Insert your own description Insert your own description Insert category name 20
Project Team Insert Name Project Manager Insert Name Insert Role Insert Name Insert Role Insert Name Insert Role Insert Name Insert Role Insert Name Insert Role Insert Name Insert Role Insert Name Insert Role Insert Name Insert Role 21
Additional template Project Team Insert Name Insert Role Insert Name Insert Role Insert Name Insert Role Insert Name Insert Role Insert Name Insert Role Insert Name Insert Role Insert Name Insert Role Insert Name Insert Role Insert Name Insert Role Insert Name Insert Role Insert Name Insert Role Insert Name Insert Role Insert Name Insert Role 22
Additional template Project Team Insert Name Insert Role Insert Name Insert Role Insert Name Insert Role Insert Name Insert Role Insert Name Insert Role Insert Name Insert Role Insert Name Insert Role Insert Name Insert Role Insert Name Insert Role Insert Name Insert Role Insert Name Insert Role Insert Name Insert Role Insert Name Insert Role Insert Name Insert Role Insert Name Insert Role Insert Name Insert Role Insert Name Insert Role Insert Name Insert Role Insert Name Insert Role Insert Name Insert Role Insert Name Insert Role Insert Name Insert Role 23
Project Approach Week 1 2 3 4 5 6 7 8 9 10 11 12 Starts on 7/1 14/1 Insert name of Phase I Insert name of Phase II Insert name of Phase III 24
Project High-level Plan = Key deliverable Week 1 2 3 4 5 6 7 8 9 10 11 12 Starts on 7/1 14/1 Insert name of Phase I 1.1 Insert name of activity 1.2 Activity 1.3 Activity Phase II 2.1 Activity 2.2 Activity 2.3 Activity Phase III 3.1 Activity 3.2 Activity 3.3 Activity 25
Table of Contents Project Description Project Assessment 1.Business opportunity & suggested solution 5.Strategic Alignment 2.Project objectives and key performance indicators (KPIs) 3.Project scope, approach and high-level plan 7.Ease of Implementation 6.Value 4.Deliverables, activities & key success factors 26
Phase I 1 2 3 Objectives Replace this text with your own text Replace this text with your own text Replace this text with your own text Key Success Factors Replace this text with your own text Replace this text with your own text Replace this text with your own text Deliverable examples Key Activities & Milestones Replace this text with your own text Replace this text with your own text Replace this text with your own text Replace this text with your own text Key Deliverables Replace this text with your own text Replace this text with your own text Replace this text with your own text 27
Tutorial Phase I 1 2 3 Objectives Replace this text with your own text Replace this text with your own text Replace this text with your own text Key Success Factors Replace this text with your own text Replace this text with your own text Replace this text with your own text Deliverable examples Key Activities & Milestones Replace this text with your own text Replace this text with your own text Replace this text with your own text Replace this text with your own text Replace these images with images of your own deliverables so your stakeholders can better imagine what will be done Key Deliverables Replace this text with your own text Replace this text with your own text Replace this text with your own text 28
Phase II 1 2 3 Objectives Replace this text with your own text Replace this text with your own text Replace this text with your own text Key Success Factors Replace this text with your own text Replace this text with your own text Replace this text with your own text Deliverable examples Key Activities & Milestones Replace this text with your own text Replace this text with your own text Replace this text with your own text Replace this text with your own text Key Deliverables Replace this text with your own text Replace this text with your own text Replace this text with your own text 29
Phase III 1 2 3 Objectives Replace this text with your own text Replace this text with your own text Replace this text with your own text Key Success Factors Replace this text with your own text Replace this text with your own text Replace this text with your own text Deliverable examples Key Activities & Milestones Replace this text with your own text Replace this text with your own text Replace this text with your own text Replace this text with your own text Key Deliverables Replace this text with your own text Replace this text with your own text Replace this text with your own text 30
Table of Contents Project Description Project Assessment 1.Business opportunity & suggested solution 5.Strategic Alignment 2.Project objectives and key performance indicators (KPIs) 3.Project scope, approach and high-level plan 7.Ease of Implementation 6.Value 4.Deliverables, activities & key success factors 31
Summary of our corporate and business strategy Mission statement, vision statement and values Mission Statement Vision Statement Values Insert your own text Insert your own text Insert your own text 32
Best practice Summary of our corporate and business strategy Mission statement, vision statement and values Mission Statement Vision Statement Values Insert your own text Insert your own text Insert your own text The summary of the corporate and business strategy should already have been done by the corporate and business strategy team. Each project business case should simply include the summary. Please note that the format of this summary may be different depending on the company. But it usually includes: Mission statement Vision statement Values Strategic objectives 33
Tutorial Summary of our corporate and business strategy Mission statement, vision statement and values Mission Statement Vision Statement Values Company values (also called corporate values or core values) are the set of guiding principles and fundamental beliefs that help a group of people function together as a team and work toward a common business goal. These values are often related to business relationships, customer relationships, and company growth. Company values don t have to be unique; they should be what your company wants to see in itself and its employees. Some examples are Integrity , Trust , Accountability , Respect or Value-centricity This is the company s reason for existence or purpose. This describes the organization s desired or intended state at some point in the near or distant future. It describes the overarching intent of the organization. It describes the overarching aim of the organization as it progresses into the future. It is usually defined during a workshop with the top management. Like the Mission Statement, it is usually defined during a workshop with the top management. It should provide focus and direction and help guide decision making and actions. It should be one easily understandable sentence and, if required, a more detailed description below the main sentence. It should provide focus and direction and help guide decision making and actions. It should be one easily understandable sentence and, if required, a more detailed description below the main sentence. 34
The project is aligned with our mission statement, vision statement and values Caption: Aligned Misaligned Mission Statement Vision Statement Values Insert your own text Insert your own text Insert your own text 35
Summary of our corporate and business strategy Strategy map including our corporate and business strategic objectives Perspective Strategic objectives Insert your own text Insert your own text Insert your own text Financial Insert your own text Insert your own text Insert your own text Insert your own text Insert your own text Insert your own text Insert your own text Customer Insert your own text Insert your own text Insert your own text Insert your own text Internal Process Learning & Growth Insert your own text Insert your own text Insert your own text Insert your own text 36
The project positively impacts many of the corporate and business strategic objectives Positively impacted by the project Caption: Perspective Strategic objectives Insert your own text Insert your own text Insert your own text Financial Insert your own text Insert your own text Insert your own text Insert your own text Insert your own text Insert your own text Insert your own text Customer Insert your own text Insert your own text Insert your own text Insert your own text Internal Process Learning & Growth Insert your own text Insert your own text Insert your own text Insert your own text 37
Tutorial Summary of our corporate and business strategy Strategy map including our corporate and business strategic objectives Perspective Strategic objectives Insert your own text Please note that usually, Fortune 500 companies use Insert your own text the 4 perspectives described in this slide, which were initially introduced by the famous Strategists Norton and Kaplan. However, you may decide to use different perspectives. For example, many of our clients use 4 stakeholder groups such as: Shareholders, Customers, Employees and Communities. Insert your own text Financial Insert your own text Insert your own text Insert your own text Insert your own text Insert your own text Insert your own text Insert your own text Customer Insert your own text Insert your own text Insert your own text Insert your own text Internal Process Learning & Growth Insert your own text Insert your own text Insert your own text Insert your own text 38
Real-life example Summary of our corporate and business strategy Strategy map including our corporate and business strategic objectives Perspective Strategic objectives Increase profit Increase revenue Decrease Costs Financial Increase revenue per customer Decrease variable cost Increase number of customers Decrease fixed cost Increase customer satisfaction Customer Become a trusted brand Sell new products Understand customer segments Internal Process Shift to digital channel Decrease delivery time Create new products Learning & Growth Improve employee satisfaction Improve customer information Create a customer- focused culture Align the organization
Real-life example The project positively impacts many of the corporate and business strategic objectives Positively impacted by the project Caption: Perspective Strategic objectives Increase profit Increase revenue Decrease Costs Financial Increase revenue per customer Decrease variable cost Increase number of customers Decrease fixed cost Increase customer satisfaction Customer Become a trusted brand Sell new products Understand customer segments Internal Process Shift to digital channel Decrease delivery time Create new products Learning & Growth Improve employee satisfaction Improve customer information Create a customer- focused culture Align the organization
Based on the previous slides, we can conclude that there is a strategic alignment between the project and the corporate and business strategy Yes No 5.Strategic Alignment 7.Ease of Implementation 6.Value Low Medium High Difficult Intermediate Easy 41
Additional template Based on the previous slides, we can conclude that there is no strategic alignment between the project and the corporate and business strategy Yes No 5.Strategic Alignment 7.Ease of Implementation 6.Value Low Medium High Difficult Intermediate Easy As a result, there is no point to assess the value that the project could create, and how easy it is to implement the project. 42
Example Based on the previous slides, we can conclude that there is no strategic alignment between the project and the corporate and business strategy Yes No 5.Strategic Alignment For example, let s say a Tesla executive tries to launch a project to create a new fuel car. The project will never be approved, as it is misaligned with the vision of the company, which is to accelerate the world's transition to sustainable energy . 7.Ease of Implementation 6.Value Even if the project could generate high value a simple implementation, it will still be rejected. Low Medium High Difficult Intermediate Easy As a result, there is no point to assess the value that the project could create, and how easy it is to implement the project. 43
Table of Contents Project Description Project Assessment 1.Business opportunity & suggested solution 5.Strategic Alignment 2.Project objectives and key performance indicators (KPIs) 3.Project scope, approach and high-level plan 7.Ease of Implementation 6.Value 4.Deliverables, activities & key success factors 44
Project Initial Investment Based on our estimate, the project initial investment will be about $1.08M [insert your own number] Project Initial Investment (US$) Year 0 500,000 200,000 300,000 50,000 30,000 1,080,000 Year 1 Year 2 Year 3 Year 4 Year 5 Total 500,000 200,000 300,000 50,000 30,000 1,080,000 Insert Project Initial Investment Item #1 Insert Project Initial Investment Item #2 Insert Project Initial Investment Item #3 Insert Project Initial Investment Item #4 Insert Project Initial Investment Item #5 Total 0 0 0 0 0 Key Assumptions Insert key assumption which you used to estimate the project costs Insert key assumption which you used to estimate the project costs Insert key assumption which you used to estimate the project costs 45
Project Costs Based on our estimate, the project costs will be about $3.9M [insert your own number] over the next 5 years Project Costs Estimate in US$ millions Year 1 Year 2 Year 3 Year 4 Year 5 Total 3.9 0.0 0.0 0.0 0.0 3.9 Cost item #1 (e.g. Human resources) Cost item #2 Cost item #3 Cost item #4 Cost item #5 Total Costs 2.1 0.0 0.0 0.0 0.0 2.1 1.2 0.0 0.0 0.0 0.0 1.2 0.4 0.0 0.0 0.0 0.0 0.4 0.1 0.0 0.0 0.0 0.0 0.1 0.1 0.0 0.0 0.0 0.0 0.1 Key Assumptions Insert key assumption which you used to estimate the project costs Insert key assumption which you used to estimate the project costs Insert key assumption which you used to estimate the project costs 46
Project Costs Based on our estimate, the project costs will be about $3.9M [insert your own number] over the next 5 years Best practice Project Costs Estimate in US$ millions Year 1 Year 2 Year 3 Year 4 Year 5 Total 3.9 0.0 0.0 0.0 0.0 3.9 Cost item #1 (e.g. Human resources) Cost item #2 Cost item #3 Cost item #4 Cost item #5 Total Costs 2.1 0.0 0.0 0.0 0.0 2.1 1.2 0.0 0.0 0.0 0.0 1.2 0.4 0.0 0.0 0.0 0.0 0.4 0.1 0.0 0.0 0.0 0.0 0.1 0.1 0.0 0.0 0.0 0.0 0.1 The best practice is to create a financial model in Excel. Then you can copy and paste the table into the PowerPoint by using the paste option Picture or, for better quality, Picture enhanced metafile . Key Assumptions To create the table and charts in this document, we used the document called Project Financial Model. Please note that if you need a more complex financial model, you can also use the Excel document called Sophisticated Financial Model. Insert key assumption which you used to estimate the project costs Insert key assumption which you used to estimate the project costs Don t forget to mention all the key assumptions that you used. Insert key assumption which you used to estimate the project costs 47
Additional Revenue Generated Based on our estimate, the additional revenue generated by the project will be about $20M [insert your own number] over the next 5 years Additional Revenue Generated Estimate in US$ millions Year 1 Year 2 Year 3 Year 4 Year 5 Total 20.0 0.0 0.0 0.0 0.0 20.0 Additional Revenue on item #1 Additional Revenue on item #2 Additional Revenue on item #3 Additional Revenue on item #4 Additional Revenue on item #5 Total Additional Revenue 1.0 0.0 0.0 0.0 0.0 1.0 2.0 0.0 0.0 0.0 0.0 2.0 4.0 0.0 0.0 0.0 0.0 4.0 5.0 0.0 0.0 0.0 0.0 5.0 8.0 0.0 0.0 0.0 0.0 8.0 Key Assumptions Insert key assumption which you used to estimate the project costs Insert key assumption which you used to estimate the project costs Insert key assumption which you used to estimate the project costs 48
Additional Revenue Generated Based on our estimate, the additional revenue generated by the project will be about $20M [insert your own number] over the next 5 years Best practice Additional Revenue Generated Estimate in US$ millions Year 1 Year 2 Year 3 Year 4 Year 5 Total 20.0 0.0 0.0 0.0 0.0 20.0 Additional Revenue on item #1 Additional Revenue on item #2 Additional Revenue on item #3 Additional Revenue on item #4 Additional Revenue on item #5 Total Additional Revenue 1.0 0.0 0.0 0.0 0.0 1.0 2.0 0.0 0.0 0.0 0.0 2.0 4.0 0.0 0.0 0.0 0.0 4.0 5.0 0.0 0.0 0.0 0.0 5.0 8.0 0.0 0.0 0.0 0.0 8.0 The Additional Revenue of an item is usually calculated by: 1. Creating a baseline where you estimate the future revenue of the company without the project being implemented Key Assumptions 2. Estimating the future revenue of the company with the project being implemented Insert key assumption which you used to estimate the project costs 3. Comparing the two estimates Insert key assumption which you used to estimate the project costs Insert key assumption which you used to estimate the project costs 49
Cost Savings Based on our estimate, the cost savings generated by the project will be about $7M [insert your own number] over the next 5 years Cost Savings Estimate in US$ millions Year 1 Year 2 Year 3 Year 4 Year 5 Total 7.0 0.0 0.0 0.0 0.0 7.0 Cost Savings on item #1 Cost Savings on item #2 Cost Savings on item #3 Cost Savings on item #4 Cost Savings on item #5 Total Cost Savings 1.0 0.0 0.0 0.0 0.0 1.0 1.0 0.0 0.0 0.0 0.0 1.0 1.0 0.0 0.0 0.0 0.0 1.0 2.0 0.0 0.0 0.0 0.0 2.0 2.0 0.0 0.0 0.0 0.0 2.0 Key Assumptions Insert key assumption which you used to estimate the NPV Insert key assumption which you used to estimate the NPV Insert key assumption which you used to estimate the NPV For more details, please refer to the Excel document called Project Financial Model 50


")


![Project Initiation Document for [Insert.Project.name] [Insert.Project.number]](/thumb/226757/project-initiation-document-for-insert-project-name-insert-project-number.jpg)