Stress and Strain Diagrams in Materials Engineering
Explore the classification of loads on materials, including normal, shear, and torsion loads. Learn about stress and strain measurement, equations, and the basics of material deformation. Dive into the EN400 course overview, covering boat movement and shipbuilding fundamentals.

Download Presentation

Please find below an Image/Link to download the presentation.
The content on the website is provided AS IS for your information and personal use only. It may not be sold, licensed, or shared on other websites without obtaining consent from the author. If you encounter any issues during the download, it is possible that the publisher has removed the file from their server.
You are allowed to download the files provided on this website for personal or commercial use, subject to the condition that they are used lawfully. All files are the property of their respective owners.
The content on the website is provided AS IS for your information and personal use only. It may not be sold, licensed, or shared on other websites without obtaining consent from the author.
E N D
Presentation Transcript
Stress and Strain Diagram Sections 5.1-5.3
Overview of EN400 So Far All Boat Movement: Chapter 1: Introduction Chapter 2: Hull Form and Geometry Chapter 3: Hydrostatics Chapter 4: Stability Where We are Going How to Build a Ship Chapter 5: Materials Chapter 6: Loading and Structure Chapter 7: Resistance and Powering Chapter 8: Waves and Seakeeping Chapter 9: Maneuverability Chapter 10: Submarines
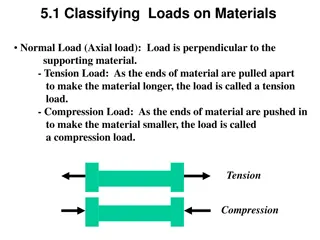
Classifying Loads on Materials Normal Load (Axial Load): Load is perpendicular to the supporting material. Tension Load: As the ends of material are pulled apart to make the material longer Compression Load: As the ends of material are pushed in to make the material smaller Tension Compression
Classifying Loads on Materials Shear Load : Tangential load, pulling or ripping apart Cargo Pressure
Classifying Loads on Materials Torsion Loads: Angular distortion on a component, such as a shaft, when a moment is applied. (Twisting) Thermal Loads: Distortion caused by heating or cooling a material. If a material is constrained in any direction, then the material will experience a normal load in the constrained plane as it is heated or cooled.
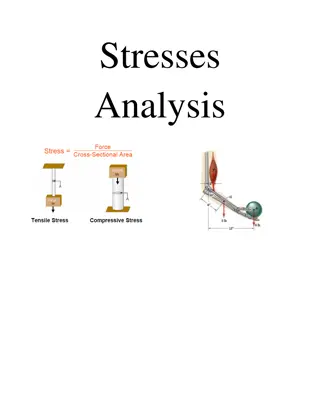
Stress () In order to compare materials, we measure stress and strain. Stress ( ): load per unit area, load carrying capability When you get stressed out your load is more than you can carry Equation Sheet (Ch. 5) F : load applied (lbs) A : cross sectional area (in ) : stress (psi) A F F
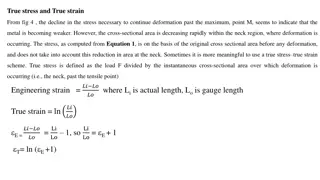
Strain () Strain ( ) : Ratio of elongation of a material to the original length, unit deformation, measurement of stretch Lo e L : strain (ft/ft) or (in/in) e : Elongation (ft) Lo : unloaded (original) length of a material (ft) Elongation (e) : ? = ? ?0 L : loaded length of a material (ft) Equation Sheet (Ch. 5)
Stress-Strain Diagram A plot of Strain vs. Stress for material placed under a normal load Strain ( ) (x axis) Stress ( ) (y axis) The diagram gives us the behavior of the material and material properties Each material produces a different stress-strain diagram. We will produce these in Lab #6
Baldwin Hydraulic Machine for Tension & Compression Test
Stress-Strain Diagram Strain ( ) (e/Lo)
Stress-Strain Diagram yield strength 2 Elastic Region 1 Strain ( ) (e/Lo)
Stress-Strain Diagram Elastic Region (Point 1 2) The material will return to its original shape after the material is unloaded (like a rubber band). The stress is linearly proportional to the strain in this region. or : Stress (psi) E : Elastic modulus (Young s Modulus) (psi) : Strain (in/in) Point 2: Yield Strength ( y) Point at which permanent deformation occurs. (If it is passed, the material will no longer return to its original length)
Stress-Strain Diagram Elastic Region The strain, or elongation over a unit length, will behave linearly (as in y=mx +b) and thus predictable. Where slope of the line = E : Elastic modulus (Young s Modulus) (psi) The material will return to its original shape (Point 1) once an applied load is removed. The stress within the material is less than what is required to create a plastic behavior (deform or stretch significantly without increasing stress).
Stress-Strain Diagram ultimate tensile strength 3 yield strength 2 Plastic Region Elastic Region 4 1 Strain ( ) (e/Lo)
Stress-Strain Diagram Plastic Region (Point 2 on) If the material is loaded beyond the yield strength, the material will not return to its original shape after unloading. It will have some permanent (plastic) deformation. If the material is unloaded at Point 3, the curve will proceed from Point 3 to Point 4. The slope will be the same as the slope between Point 1 and 2. The distance between Point 1 and 4 indicates the amount of permanent deformation.
Stress-Strain Diagram ultimate tensile strength 3 necking Strain Hardening yield strength Fracture 5 2 Plastic Region Elastic Region 4 1 Strain ( ) (e/Lo)
Stress Strain Diagram Tensile Strength (Point 3) The largest value of stress on the diagram is called Tensile Strength (TS) or Ultimate Tensile Strength(UTS) It is the maximum stress which the material can support without breaking. Fracture (Point 5) If the material is stretched beyond Point 3, the stress decreases as necking and non-uniform deformation occur. Fracture will finally occur at Point 5
Stress Strain Diagram Strain Hardening If the material is loaded again from Point 4, the curve will follow back to Point 3 with the same Elastic Modulus (slope) The material now has a higher yield strength of Point 4. Raising the yield strength by permanently straining the material is called Strain Hardening.


")
")
")
")