Explore stress and strain in materials analysis, from characterizing materials to defining safety constraints. Learn about stress versus strain graphs, modeling with piecewise functions, and writing complete piecewise functions to analyze material behavior.
Please find below an Image/Link to download the presentation.
The content on the website is provided AS IS for your information and personal use only. It may not be sold, licensed, or shared on other websites without obtaining consent from the author. If you encounter any issues during the download, it is possible that the publisher has removed the file from their server.
You are allowed to download the files provided on this website for personal or commercial use, subject to the condition that they are used lawfully. All files are the property of their respective owners.
The content on the website is provided AS IS for your information and personal use only. It may not be sold, licensed, or shared on other websites without obtaining consent from the author.
Introduction to Stress and Strain (Lesson) Stress versus Strain Graph Stress (N/m2) Mechanical Engineers characterize materials using forces, stress, and strain. They analyze the behavior of materials in order to define safety constraints. In simple terms, they need to determine how much stress can be applied before the material breaks or becomes permanently deformed. Biomedical engineers test materials to strengthen or replace tissues or broken bones. Point of Fracture Elastic Region (linear) Yield Stress Deformation (or ductile) Region Strain
Modeling with Piecewise Functions Strain (mm/mm) Stress (N/mm2) Step 1: Create a table in Desmos and adjust the window to show all the data points in a Scatterplot. 0 0 .002 9 .004 16 .005 24 .007 32 .010 43 .012 51 .014 60 .016 68 .019 77 .023 85 .028 90 .035 94 .042 93 .047 90 . . . .054 86 .060 80
Step 2: Determine the point where the linear and ductile regions meet. Step 3: Create a second table in Desmos and retype the points representing the ductile region. If there is a point beyond the obvious fraction point, do not include it in either set. The last point in the linear region should be the first point in the ductile region. Set them to a different color than the points in the first table. Step 4: Delete the ductile region points from the first table. Strain (mm/mm) Stress (N/mm2) 0 0 .002 9 .004 16 .005 24 .007 32 .010 43 .012 51 .014 60 .016 68 .019 77 .023 85 .028 90 .035 94 .042 93 .047 90 . . . .054 86 .060 80
Step 5: Run a linear regression on the first data set. Add a new entry below the table and type ?1~??1+ ?. Notice the tilde in lieu of an equal sign. Set the color to match the data points. Restrict the domain appropriately. Step 6: Run a higher ordered polynomial regression on the second data set. You may have to test quadratic, cubic, or quartic to determine the best fit. If the r value does not change much with each higher order, there is no need to add complexity. To run a quadratic regression you would type ?2~??2 2+ ??2+ ?. Restrict the domain appropriately. When writing the piecewise function, you would write the second function beginning with an open interval but sometimes Desmos only works with a <= sign on a restricted domain.
Step 7: Write the complete piecewise function. 3853? + 3 33991?2+ 2618? + 43,.023 < ? .060 ,0 ? .023 ? ? = When writing the piecewise function, you would write the second function beginning with an open interval but sometimes Desmos only works with a <= sign on a restricted domain.
Newtons Second Law The equation for Newton s second law is: ? = ?? In engineering, weight is considered a force and is measured in Newtons. The units for mass are kg. Gravity is used for acceleration as 9.8 m/s2. One Newton is equal to 1 kilogram meter per second squared. If you have forgotten this from Science class, in simplest terms, when you are given a mass in kg, simply multiply it by 9.8 m/s2 to find the force in Newtons. Example: Callie the 30 kg Catahoula Leopard Dog is standing on top of a force scale. What is the reading on the scale in N?
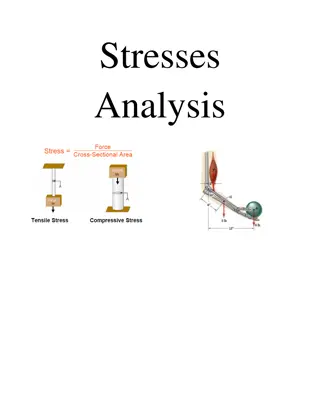
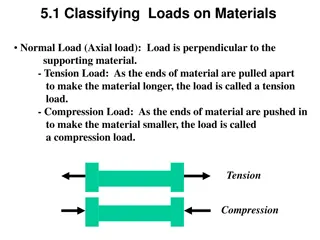
Stress A force (compression=push or tensile=pull) applied to an object compared to its cross-sectional area measured in N/m2. The formula for stress is ? =? ?. The formula for stress (?) is shown below, where force (F) is measured in Newtons and area is measured in square meters. Hence, stress is measured in N/m2. candy under compression Example: A 3 m length of wire with a 2.4 mm diameter supports a 2.6 kg prism hanging in the classroom. Determine the stress on the wire. candy under tension
Strain How an object changes shape in response to stress compared to its original length. The units cancel making it a dimensionless measurement. The equation for strain is ? = ? ?. Stress versus Strain Graph Stress (N/m2) Example: If the wire from the previous problem stretches 1.40?10 4 ?, determine the strain on the wire. Stress-Strain Relationship The more force you apply, the more an object will deform, depending on the material. Engineers and scientists analyze data and graph the stress- strain curve and perform a linear regression. Strain
Example: Mrs. Walsh hangs a 1400 g framed portrait of her four cats Snickers, Tracksaur, Pickles, and JoJo. She secures it to a 1.6 m piece of yarn with a diameter of 5mm that has a Young s modulus of 9.3 x 10⁶. How much does the yarn stretch? Young s Modulus (Modulus of Elasticity) A mechanical property measuring the elasticity of a material prior to any permanent deformation. It is the relationship between stress and strain on the linear part of a stress versus strain graph. (The slope of the linear section.) Example: Determine the Young s Modulus of the earlier wire problem.