Structural Variations in Interaction Effects within the Motorpool Dataset
In the context of the Motorpool dataset, structural variations and interactions are explored, focusing on how the effect of one explanatory variable on the dependent variable can change based on another variable. The technique involves introducing the product of the two variables as a new artificial explanatory variable. Through regression analysis and interpretation, the significance of coefficients is assessed to determine the impact of variables like age, sex, direct and indirect incentives on revenue generated. The findings emphasize the importance of considering interaction effects in modeling and decision-making processes.

Download Presentation

Please find below an Image/Link to download the presentation.
The content on the website is provided AS IS for your information and personal use only. It may not be sold, licensed, or shared on other websites without obtaining consent from the author. If you encounter any issues during the download, it is possible that the publisher has removed the file from their server.
You are allowed to download the files provided on this website for personal or commercial use, subject to the condition that they are used lawfully. All files are the property of their respective owners.
The content on the website is provided AS IS for your information and personal use only. It may not be sold, licensed, or shared on other websites without obtaining consent from the author.
E N D
Presentation Transcript
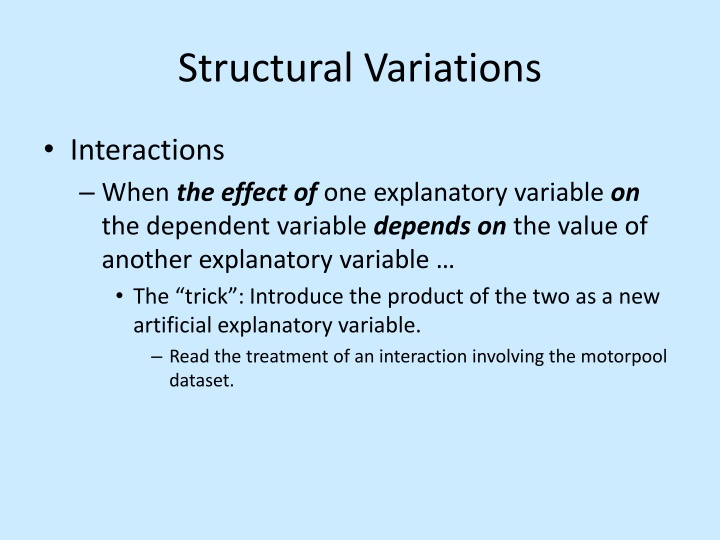
Structural Variations Interactions When the effect of one explanatory variable on the dependent variable depends on the value of another explanatory variable The trick : Introduce the product of the two as a new artificial explanatory variable. Read the treatment of an interaction involving the motorpool dataset.
Interactions: Summary When the effect (i.e., the coefficient) of one explanatory variable on the dependent variable depends on the value of another explanatory variable Signaled only by judgment The trick : Introduce the product of the two as a new artificial explanatory variable. After the regression, interpret in the original conceptual model. For example, Cost = a + (b1+b2 Age) Mileage + (rest of model) The latter explanatory variable (in the example, Age) might or might not remain in the model Cost: We lose a meaningful interpretation of the beta-weights
Caligulas Castle Sex Dir Sex Indir Revenue 1390 Age Sex Direct Indirect 64 1 383 17 196 47 50 119 229 99 284 43 345 383 204 353 350 17 196 47 50 Does the effect of Indirect or Direct incentives on Revenue generated by a guest depend on the guest s Sex? 1187 51 1 204 1426 38 1 353 1379 58 1 350 777 28 0 281 1453 49 1 171 1536 57 1 301 1471 59 1 116 1142 55 1 357 521 35 0 0 0 171 301 116 357 229 99 284 43 55 0 0 Revenue (from patron s weekend visit), Age in years, Sex (woman = 1, man = 0), Direct incentive value (free chips, VIP lounge pass, etc.), Indirect incentive value (free dinner, room upgrade, flowers, etc.), and two columns of artificial created data.
Caligulas Castle Does the effect of Indirect or Direct incentives on Revenue generated by a guest depend on the guest s Sex? Regression: Revenue constant -193.1901 14.2887-161.4025 1.5775% 0.0000% 2.2988% 0.0000% 0.0005% 80.3315% 0.0000% Age Sex Direct 1.9839 Indirect 0.9152 Sex Dir 0.0678 Sex Ind 1.4677 coefficient significance The significance level of the data, with respect to the null hypothesis that the true coefficient of Sex Direct is 0, is 80.33%. Hence, we have no real evidence against the null hypothesis, and therefore no real evidence supporting the inclusion of Sex Direct in our model.
Caligulas Castle Regression: Revenue Indirect Sex Ind 0.9186 constant Age Sex Direct 2.0185 coefficient -198.7856 14.2824-150.2805 significance 0.9510% 0.0000% 0.6260% 0.0000% 0.0004% 0.0000% 1.4607 Revenuepred = -198.79 + 14.28 Age 150.28 Sex + 2.02 Direct + (0.9186+1.4607 Sex) Indirect revenue / $ incentive direct indirect = (0.9186 + 1.4607 0) Men (Sex=0) $2.02 $0.92 = (0.9186 + 1.4607 1) Women (Sex=1) $2.02 $2.38 Give direct incentives (house chips, etc.) to men Give indirect incentives (flowers, meals) to women
Hans and Franz Franz? Sz Franz? 0 1 1 1 1 0 0 1 1 1 0 CustSat Wait Size Customer satisfaction with service (-100 to +100), Wait (minutes) before being seated, Size of customer s party, whether party is assigned to Franz (Franz? = 1, or Hans (Franz? = 0), and an artificial created variable. -15 55 48 58 45 34 23 47 -3 38 -8 18 5 4 1 8 14 10 0 25 15 20 10 0 5 2 6 4 5 2 6 4 9 8 1 1 3 9 0 0 1 1 3 0
Hans and Franz Is one of the ma tres d hotel better than the other at satisfying relatively small parties? Equivalently, does the effect of assigned ma tre d on party satisfaction depend onthe size of the party? Regression: CustSat constant 88.0462 Wait -2.0925 Size -5.4858 -39.4047 Franz? Size Fr? 8.6784 coefficient significance 0.0000% 0.0000% 0.0000% 0.0000% 0.0000% CustSatpred = 88.0462 2.0925 Wait 5.4858 Size + (-39.4047+8.6784 Size) Franz? Conclusion: Set Franz? = 0 (assign Hans) when the party size is < 39.4047/8.6784 = 4.54 (i.e, 4).