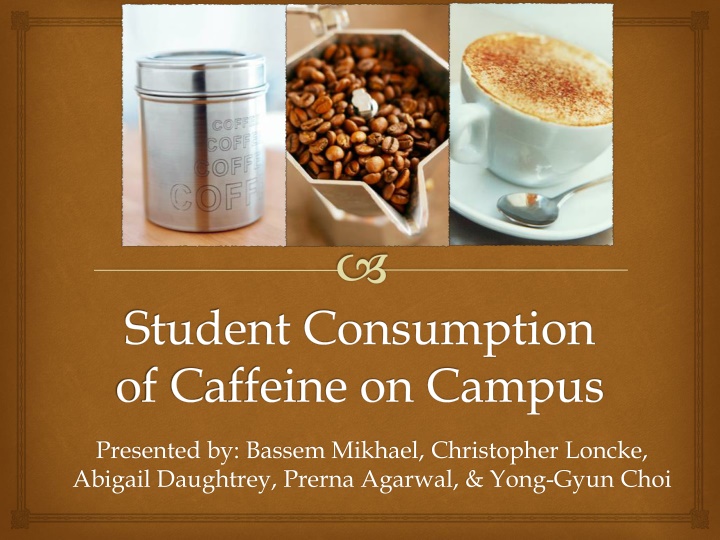
Student Consumption of Caffeine on Campus Research Study
Explore the insights from a research study on caffeine consumption patterns among students at Carnegie Mellon University. The study delves into factors such as academic performance, activity levels, and perception of consumption. Discover the reasons for conducting the survey, the survey goals, sample construction methodology, survey size considerations, and the types of questions included in the survey related to general well-being, caffeine product consumption, and student perception.

Download Presentation

Please find below an Image/Link to download the presentation.
The content on the website is provided AS IS for your information and personal use only. It may not be sold, licensed, or shared on other websites without obtaining consent from the author. If you encounter any issues during the download, it is possible that the publisher has removed the file from their server.
You are allowed to download the files provided on this website for personal or commercial use, subject to the condition that they are used lawfully. All files are the property of their respective owners.
The content on the website is provided AS IS for your information and personal use only. It may not be sold, licensed, or shared on other websites without obtaining consent from the author.
E N D
Presentation Transcript
Student Consumption of Caffeine on Campus Presented by: Bassem Mikhael, Christopher Loncke, Abigail Daughtrey, Prerna Agarwal, & Yong-Gyun Choi
Agenda Recap of: Research Questions Sample Size and Construction Survey Methodology Survey Responses Analysis Future Work
Introduction - Research Question Caffeine consumption patterns at Carnegie Mellon University? Correlation to various factors such as GPA/activity level, etc.? Student perception of consumption
Reason for Survey Damaging health effects of excessive caffeine consumption Concern that students today consume large amounts of caffeine Keeping up with academic workload or athletics
Goal of Survey Questions Demographic Information Year; College Gender Academic Performance Major & Minor GPA and Units taken this semester Time spent on class work Extracurricular Involvement Activities Part-time work Leisure Time
Some more questions General Well-being: Sleeping patterns. Exercise schedule What caffeine products are consumed and in what quantity? Student Perception: Reason for consumption Comfort with amount currently consumed
Sample Size Initially we considered a 500 student non stratified sample Switched to stratified by year (including 5th) Wanted a ME of 0.1 ME formula for stratified sample: 2 ? ? 2(1 ? ) ME = (1.96) x 1 ? (? ? ? )
Sample Size Modified the formula to include only info. we know/can estimate. ME = 0.1 Nn= Population size of the strata N = overall population Sh= 2 for the question How many servings of caffeine? based on our group and pretesting f = proportion of the strata we need to sample (what we don t know) 2 ? ? 2(1 ? ) ME = (1.96) x 1 ? (? ? ? )
Selecting the Sample When we plug the strata and overall population numbers into the equation we need Year Number Needed 20 18 18 17 3 76 Number Selected 120 108 108 102 18 456 Freshmen Sophomores Juniors Seniors 5th Years Total Assuming a (conservative) 15% response rate Students were randomly selected from C-Book
Google Form Used a Google Form to create the survey Responses are automatically entered into a spreadsheet for easy processing Modifications: Changing question type to allow for multiple responses
Sample Selection Random Number Generator First number: Page number Second number: Line number on that page Problem of Duplication Master d-list created Composed email with link to survey Included incentive description
Responses 230 Responses Response rate: 50.43% Nonresponse: $50 Incentive Reminder Email
Respondent Attributes Opposite of campus population
Respondent Attributes Good distribution across college
Respondent Attributes Good distribution across GPA
Respondent Attributes Good busyness distribution
Respondent Attributes Do you believe your caffeine consumption is above/below average relative to your peers? Average Above Average Below Average Egocentric bias?
Caffeine Consumption How many caffeinated beverages do you consume per day? None More than 6 2-4 Fewer than 2
Caffeine Motivation What is your primary motivation for consuming caffeine? Don t consume caffeine Partying To stay awake/maintain energy Pleasure/Leisure
Caffeine and Health Do you believe that consuming caffeine negatively affects your health?
Health Concerns Do Not Affect Caffeine Consumption Level N Mean StDev ---------+---------+---------+---------+ No 71 2.986 1.855 (-----------*------------) Yes 152 2.447 1.880 (--------*-------) ---------+---------+---------+---------+ 2.45 2.80 3.15 3.50 P-value is 0.047 Pooled StDev = 1.872 Since these two intervals overlap, we can not conclude statistical significance however there is still a note-worthy difference.
Students Who Think That Caffeine Positively Impacts Performance Consume More Caffeine Level N Mean StDev ----+---------+---------+---------+----- No 120 2.142 1.712 (------*-----) Yes 103 3.175 1.932 (------*-------) ----+---------+---------+---------+----- 2.00 2.50 3.00 3.50 P-value = 0 Pooled StDev = 1.817 Statistically significant difference!
Fifth Years Consume the Most Caffeine on Campus Level N Mean StDev --+---------+---------+---------+------- Fresh 58 2.310 1.912 (----*----) Sphmrs 69 2.667 1.788 (----*---) Jrs 44 2.523 1.911 (----*-----) Senrs 44 2.659 1.916 (-----*----) 5th 9 4.222 1.787 (-----------*------------) --+---------+---------+---------+------- P-value=0.083 Pooled SD = 1.870
More Caffeine Means More Symptoms of Caffeine Addiction Level N Mean StDev -------+---------+---------+---------+-- None 38 0.868 1.212 (-----*----) <2 112 1.098 1.530 (--*--) 2-5 56 1.750 2.029 (----*---) 7+ 8 2.625 3.378 (-----------*-----------) -------+---------+---------+---------+-- 1.0 2.0 3.0 4.0 P-value = 0.007 Pooled StDev = 1.719 Statistically Significant Difference!!
More Caffeine Means Less Sleep Level N Mean StDev -------+---------+---------+---------+-- <3 4 6.500 1.000 (--------*-------) 3-5 48 2.833 2.046 (-*--) 5-8 153 2.575 1.708 (-*) 8+ 19 1.474 1.896 (---*---) -------+---------+---------+---------+-- 2.0 4.0 6.0 8.0 P-value = 0 Pooled StDev = 1.794 Statistically Significant Difference!!
Fifth Years get Less Sleep Than Seniors Level N Mean StDev ----+---------+---------+---------+----- Frsh 58 5.552 1.477 (----*----) Soph 69 5.754 1.049 (---*----) Jr 44 5.886 1.401 (-----*-----) Sr 44 6.091 1.378 (-----*-----) 5th 9 4.778 1.986 (-----------*------------) ----+---------+---------+---------+----- 4.20 4.90 5.60 6.30 P-value = 0.059 Pooled StDev = 1.346 Statistically Significant Difference!!
Freshmen are Less Busy Than Sophomores & Juniors; Fifth Years More Busy Than Seniors Level N Mean StDev --------+---------+---------+---------+- Fresh 59 7.644 6.351 (--*---) Sphmrs 69 12.188 7.303 (--*---) Jrs 44 11.182 7.565 (---*----) Senrs 44 10.386 6.560 (---*---) 5th 9 17.333 9.798 (---------*--------) --------+---------+---------+---------+- 10.0 15.0 20.0 25.0 P-value = 0 Pooled StDev = 7.086 Statistically Significant Difference!!
Tepper and HSS more Busy than SCS and CIT Level N Mean StDev -------+---------+---------+---------+-- CFA 32 12.719 7.912 (------*------) CIT 68 9.294 6.227 (----*---) H&SS 62 12.194 7.971 (----*----) MCS 30 8.833 7.808 (------*-------) SCS 20 7.550 6.004 (--------*--------) Tepper 13 14.308 5.893 (----------*----------) -------+---------+---------+---------+-- 7.0 10.5 14.0 17.5 Pooled StDev = 7.178 P-value = 0.006 Statistically Significant Difference!!
HSS Have More Working Hours than CIT, SCS Level N Mean StDev +---------+---------+---------+--------- CFA 32 5.406 6.242 (------*------) CIT 68 3.279 5.131 (----*----) H&SS 62 6.565 7.421 (----*----) MCS 29 3.690 5.484 (------*-------) SCS 20 2.600 5.807 (--------*--------) Tepper 13 7.462 5.753 (----------*----------) +---------+---------+---------+--------- 0.0 3.0 6.0 9.0 P-Value = 0.010 Pooled StDev = 6.137 Statistically Significant Difference!!
Variable Significance Variable Busyness P-value p = 0.033 p < 0.0009 p < 0.0009 p = 0.024 p = 0.593 p < 0.0009 p = 0.315 Below Average Consumption Above Average Consumption Comfort Level Consumes to Stay Awake Does not consume caffeine Is a Fifth Year
General Regression Model Caffeine Consumption = 2.31419 + 0.03118 * (Busyness) + 1.38030 * (Below Average Consumption) + 2.45278 * (Above Average Consumption) + -0.59294 * (Comfort Level) + -0.11757 * (Consumes to Stay Awake) + -1.9187 * (Does not consume caffeine) + 0.54911 * (Is a Fifth Year) + R2 = 40.61% and R2 (adj)= 40.61%
Mosaic Plot Dependent Relationship Between Busyness and Year Busyness Low Fifth Years High Moderate Class is independent of busyness score Pearson residuals: 1.42 Year Not Fifth 0.00 -0.87 p-value = 0.19011
Class vs. Busyness vs. GPA Relationship Between Class and Busyness - Specified by GPA GPA:0.00-2.50 GPA:2.50-3.00 3.00-3.50 3.50-4.00 30 25 20 Busyness Score 15 10 5 0 1 2 3 4 5 Student Class Level 1:Freshman 2:Sophomore 3:Junior 4:Senior 5:5th Year
Jittered Class vs. Busyness vs. GPA Relationship Between Class and Busyness - Specified by GPA (Jittered) GPA:0.00-2.50 GPA:2.50-3.00 3.00-3.50 3.50-4.00 30 25 20 Busyness Score 15 10 5 0 1 2 3 4 5 Student Class Level 1:Freshman 2:Sophomore 3:Junior 4:Senior 5:5th Year
Analysis Yet to be Performed Checking for interactions Post-stratification exploration