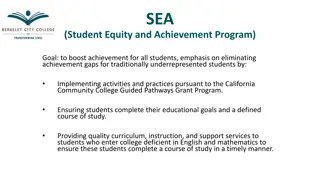
Student Equity and Achievement Metrics for College Success
Explore the key metrics and factors affecting student equity and achievement in college, including successful enrollment, transfer rates, and primary subgroups. Learn about disproportionate impact and the PPG-1 method to address disparities. Source insights from CCC Student Success Metrics Cohort View.
Download Presentation

Please find below an Image/Link to download the presentation.
The content on the website is provided AS IS for your information and personal use only. It may not be sold, licensed, or shared on other websites without obtaining consent from the author. If you encounter any issues during the download, it is possible that the publisher has removed the file from their server.
You are allowed to download the files provided on this website for personal or commercial use, subject to the condition that they are used lawfully. All files are the property of their respective owners.
The content on the website is provided AS IS for your information and personal use only. It may not be sold, licensed, or shared on other websites without obtaining consent from the author.
E N D
Presentation Transcript
Reviewing Student Equity & Achievement Metrics Dominique Benavides, Director of College Research & Planning SEPTEMBER 21, 2022
Persisted First Primary Term to Subsequent Primary Term Successful Enrollment in the First Year Which metrics will be evaluated? Completed Both Transfer Level Math and English Transferred to a Four-Year Institution Attained the Vision Goal Completion Definition
Primary Subgroups Primary Subgroups Gender Gender Gender Ethnicity Ethnicity Ethnicity Ethnicity Ethnicity Ethnicity Ethnicity Ethnicity Perkins Economically Disadvantaged Perkins Economically Disadvantaged First Generation First Generation First Generation Foster Youth Foster Youth DSPS DSPS Veterans Veterans LGBT LGBT Homeless Homeless Primary Disaggregated Subgroups Primary Disaggregated Subgroups Female Male Unknown/Non-Respondent American Indian/Alaska Native Asian Black or African American Filipino Hispanic Pacific Islander or Hawaiian Native White Two or More Races Perkins Economically Disadvantaged Not Perkins Economically Disadvantaged First Generation Student Not First-Generation Student Unknown/Unreported Foster Youth Not Foster Youth Student Who Received Disability Services Not a Student Who Received Disability Services Veteran Not Veteran LGBT Non-LGBT Homeless Not Homeless What are the Student Equity Groups?
Disproportionate impact occurs when a subset of students based on a student characteristic such as age, race, or gender have observably different outcomes when compared to the total student population. What is Disproportionate Impact? Source: CCCCO Percentage Point Gap Update
Percentage Point Gap Minus One (PPG-1) Method
Source: CCC Student Success Metrics Cohort View https://www.calpassplus.org/Launchboard/Student-Success-Metrics-Cohort-View
Successful Enrollment in the First Year Among first-time applicants who indicated an intent to enroll in the selected college in the selected year, the percentage who enrolled in the Same Community College in their First Year % who enrolled (overall percent) 33% 33% No. of students that enrolled (numerator) 288 288 No. of CCC Apply applicants (denominator) 870 870 Subgroup Subgroup Outcome Rate Outcome Rate 27% 27% Numerator Numerator Denominator Denominator Gender Primary Equity Group Female Students 125 461 Male Students 13% 159 399 All Other Students Unknown/Non-Respondent 7% 4 10 163 409 40% Percentage Point Gap Method Minus One (PPG -1) Primary Equity Group - -13% 13% 40% 27% Percentage Point Gap minus one (+/-) All Other Students Source: CCC Student Equity & Achievement files (340_108667_REVISED_20220801)
Source: CCC Student Success Metrics Cohort View https://www.calpassplus.org/Launchboard/Student-Success-Metrics-Cohort-View
Persisted First Primary Term to Subsequent Primary Term Among first-time cohort students, the proportion who enrolled in the subsequent primary term after their first primary term of enrollment No. of first-time students enrolled in Fall 19 (denominator) 906 906 No. of first-time students who persisted to the next primary term (numerator) 470 470 % retained (overall percent) 52% 52% The table below reflects the subgroups who have been determined to be disproportionately impacted using the percentage point gap method in 2019-20 Subgroups with a percentage point gap of 3% or more suggest a disproportionate impact exists. Subgroup Subgroup Outcome Rate Outcome Rate (for all other students) 54% Percentage Point Gap Percentage Point Gap (% of subgroup) (% of all other) (% of subgroup) (% of all other) Subgroup Subgroup Outcome Rate Outcome Rate Primary Equity Group (Race/Ethnicity) Primary Equity Group (Race/Ethnicity) Numerator Numerator Denominator Denominator Black or African American 52 130 40% - -14% 14% Subgroup Subgroup Outcome Rate Outcome Rate (for all other students) Percentage Point Gap Percentage Point Gap (% of subgroup) (% of all other) (% of subgroup) (% of all other) Subgroup Subgroup Outcome Rate Outcome Rate Gender Disaggregated Subgroup Gender Disaggregated Subgroup Numerator Numerator Denominator Denominator Black or African American Male 25 67 37% 43% - -6% 6% Source: CCC Student Equity & Achievement files (340_108667_REVISED_20220801)
Source: CCC Student Success Metrics Cohort View https://www.calpassplus.org/Launchboard/Student-Success-Metrics-Cohort-View
Completed Both Transfer - Level Math and English Excluding high school students, the proportion of all students who completed transfer-level Math and English in their first academic year of credit enrollment within PCCD. % of students who successfully completed Transfer Math and English (overall percent) 19% 19% No. of 1st time students who enrolled in a credit course within PCCD (denominator) 802 802 No. of 1st time students that successfully completed Transfer Math & English in 1st year (numerator) 149 149 The table below reflects the subgroups who have been determined to be disproportionately impacted using the percentage point gap method in 2020-21. Subgroups with a percentage point gap of 3% or more suggest a disproportionate impact exists. Subgroup Subgroup Outcome Rate Outcome Rate (for all other students) Subgroup Subgroup Outcome Rate Outcome Rate Percentage Point Gap Percentage Point Gap (% of subgroup) (% of all other) (% of subgroup) (% of all other) Primary Equity Groups Primary Equity Groups Numerator Numerator Denominator Denominator Black or African American 12 112 11% 20% -9% 26 196 13% 20% -7% Hispanic/Latinx 1 18 6% 19% -13% Foster Youth 0 12 0% 19% -19% Homeless Source: CCC Student Equity & Achievement files (340_108667_REVISED_20220801)
Source: CCC Student Success Metrics Cohort View https://www.calpassplus.org/Launchboard/Student-Success-Metrics-Cohort-View
Transferred to Four Year Institution Using 2016 2016- -17 17 data and excluding high school students, the proportion of first-time cohort students who earned 12 units or more and exited in the subsequent year and enrolled in any four-year postsecondary institution. % who transferred (overall percent) 20% 20% First time student cohort +12 units (denominator) 551 551 No. of students that transferred (numerator) 112 112 The table below reflects the subgroups who have been determined to be disproportionately impacted using the percentage point gap method in 2016-17. Subgroups with a percentage point gap of 3% or more suggest a disproportionate impact exists. Subgroup Subgroup Outcome Rate Outcome Rate (for all other students) Subgroup Subgroup Outcome Rate Outcome Rate Percentage Point Gap Percentage Point Gap (% of subgroup) (% of all other) (% of subgroup) (% of all other) Primary Equity Groups Primary Equity Groups Numerator Numerator Denominator Denominator 14 129 11% 23% -12% Hispanic/Latinx 40 233 17% 23% -6% First Generation Students Students Who Received Disability Services 3 33 9% 21% -12% 0 10 0% 21% -21% Foster Youth Source: CCC Student Equity & Achievement files (340_108667_REVISED_20220801)
Attained the Vision Goal Completion Definition Excluding high school students, the proportion of first-time cohort students who attained one of the following: earned an AA, AS, AAT, and or AST; earned a Chancellor s office approved credit certificate, earned a noncredit certificate, attained apprenticeship journey status, or transferred to four-year postsecondary institution in 2017-18. First-time student cohort (denominator) 1038 1038 No. of students that attained Vision Goal by 2017-18 (numerator) 78 78 % that attained Vision Goal (overall percent) 8% 8% The table below reflects the subgroups who have been determined to be disproportionately impacted using the percentage point gap method in 2017-18. Subgroups with a percentage point gap of 3% or more suggest a disproportionate impact exists. Subgroup Subgroup Outcome Rate Outcome Rate (for all other students) Percentage Point Gap Percentage Point Gap (% of subgroup) (% of all other) (% of subgroup) (% of all other) Subgroup Subgroup Outcome Rate Outcome Rate Primary Equity Groups Primary Equity Groups Numerator Numerator Denominator Denominator Male Students 28 477 6% 9% -3% LGBT 0 37 0% 8% -8% Source: CCC Student Equity & Achievement files (340_108667_REVISED_20220801)


