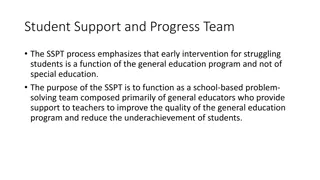
STUDENT STAFF
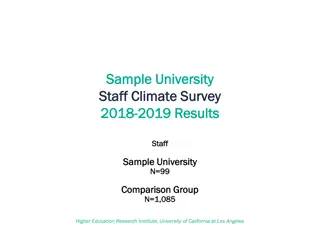
Student staff demographics from Spring 2015 are analyzed across different schools of the university, including School of Engineering and Applied Science, Economics and Management, Humanities and Social Sciences, and Education. The data provides insights into the distribution of students across freshmen, sophomore, junior, senior, and MS levels in various academic disciplines. Visual representations and percentages showcase the diversity in student populations within the university.

Download Presentation

Please find below an Image/Link to download the presentation.
The content on the website is provided AS IS for your information and personal use only. It may not be sold, licensed, or shared on other websites without obtaining consent from the author.If you encounter any issues during the download, it is possible that the publisher has removed the file from their server.
You are allowed to download the files provided on this website for personal or commercial use, subject to the condition that they are used lawfully. All files are the property of their respective owners.
The content on the website is provided AS IS for your information and personal use only. It may not be sold, licensed, or shared on other websites without obtaining consent from the author.
E N D
Presentation Transcript
STUDENT STAFF Number of students (Spring 2015)
Student Staff (in % - School) (Spring 2015) Freshmen School Sophomore Junior Senior MS Total Engineering and Social Science Economics and Management Humanities and Social Sciences Education 33,2 25,0 16,0 17,5 8,2 100 14,7 22,9 22,7 19,4 20,2 100 21,0 29,3 22,4 21,2 6,1 100 30,8 23,3 23,1 22,1 0,8 100 Total 23,8 25,1 21,7 20,4 9,0 100
Student Staff School of Engineering and Applied Science MS 8% Freshmen 33% Senior 18% Junior 16% Sophomore 25%
Student Staff School of Economics and Management Freshmen 15% MS 20% Sophomore 23% Senior 19% Junior 23%
Student Staff School of Humanities and Social Sciences MS 6% Freshmen 21% Senior 21% Sophomore 29% Junior 23%
Student Staff School of Education MS 1% Senior 22% Freshmen 31% Junior 23% Sophomore 23%
Student Staff University-wide MS 9% Freshmen 24% Senior 20% Sophomore 25% Junior 22%
Student staff (%) By schools Freshmen Sophomore Junior Senior MS 33.2 30.8 29.3 25.0 23.3 23.1 22.9 22.7 22.4 22.1 21.2 21.0 20.2 19.4 17.5 16.0 14.7 8.2 6.1 0.8 Engineering and Social Science Economics and Management Humanities and Social Sciences Education
Student staff (%) University-wide 25.1 23.8 21.7 20.4 9.0 Freshmen Sophomore Junior Senior MS

")


")
")