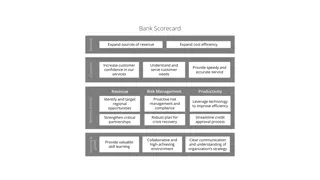
Explore the student success scorecard metrics and cohorts at Mt. San Jacinto College, including tracking criteria, measured indicators, and cohort size analysis. Gain insight into how colleges are fostering student success and narrowing achievement gaps.
Please find below an Image/Link to download the presentation.
The content on the website is provided AS IS for your information and personal use only. It may not be sold, licensed, or shared on other websites without obtaining consent from the author. If you encounter any issues during the download, it is possible that the publisher has removed the file from their server.
You are allowed to download the files provided on this website for personal or commercial use, subject to the condition that they are used lawfully. All files are the property of their respective owners.
The content on the website is provided AS IS for your information and personal use only. It may not be sold, licensed, or shared on other websites without obtaining consent from the author.
E N D
Presentation Transcript
MSJC 2016 Student Success Scorecard Presentation to the Mt. San Jacinto College Board of Trustees Feb. 9, 2017 Nikilos Mesaris Director of Institutional Research Source: CCCCO - ARCC 2016 Final Report 1.27.16 MSJC R&P Dept.
Student Success Scorecard California Legislation, Education Code, Title 3, Division 7, Part 50, Chapter 5, Article 2, 84754.5. Pursuant to provisions of Chapter 581 of the Statutes of 2004, annual evaluation of district-level performance in meeting statewide educational outcome priorities. In CCC Board of Governors commitment to increase transfer and degree and certificate attainment has established a performance measurement that tracks student success at all 113 community colleges. The scorecard provides statewide transparency and accountability on student progress and success metrics. The scorecard provides insight into how colleges are performing in remedial instruction, job training programs, retention of students and graduation and completion rates. Data is reported by gender, age, and ethnicity. Colleges, students and the public can also better determine if colleges are narrowing achievement gaps SSS tracks selected cohorts of students for 6 years, cohort selection is dependent upon each metric criteria. Link to scorecard: http://scorecard.cccco.edu/scorecardrates.aspx?CollegeID=941
Student Success Scorecard Cohorts Who is tracked? 1. First Time Students First time students who show an intent to complete. Must complete a minimum of 6 units and attempt Math or English within first 3 years to be included in the cohort. 2. Remedial Students Students who make a first attempt in a course below college transfer level in any of the three subject area cohorts; Math, English, or ESL. Students can be in one or all three subject area cohorts. 3. Career Technical Students (CTE) First time CTE students who show an intent to complete a CTE program. Must complete at least eight units in a single CTE discipline within first three years of enrollment.
Student Success Scorecard Metrics What is Measured? 1. Persistence - Students with sustained enrollment are more likely to succeed. Defined as, enrollment in 3 consecutive primary terms. 2. Complete At least 30 units - Tend to be positively correlated with completion. 3. Completion - Completed a degree, certificate, or transfer 4. Remedial - Started below transfer level in English, Math and /or ESL & completed a college-level course in the same discipline 5. Career Technical Education - Completed several courses classified as career technical in a single discipline & completed a degree, certificate or transferred
Cohort Size & Ratio of Total Student Body Count of first-time degree and/or transfer-seeking students tracked for six years First Time Students who attempt Math and English and complete at least 6 units in first 3 years. 30% 3,500 AY09-10 COMPARISON 3,264 3,139 % of Total UG Students 7,000 6,235 3,000 2,694 25% 6,000 2,422 2,500 5,000 3,967 20% 1,961 2,000 Cohort Size 4,000 3,139 1,500 3,000 COHORT HEADCOUNT 15% 1,934 Cohort as % of Total Undergraduat e MSJC Headcount 1,817 1,802 13.2% 12.5% 13.0% 2,000 1,142 1,000 12.5% 11.3% 10% 1,000 Population Growth 500 0 5% 0 AY05-06 AY06-07 AY07-08 AY08-09 AY09-10 Cohort Size 1,961 2,422 2,694 3,264 3,139 Cohort as % of Total Undergraduate MSJC Headcount Cohort Headcount 11.3% 12.5% 12.5% 13.2% 13.0% Note: Cohort consists of 1st time students with at least 6 units earned who attempted any Math or English in their first three years
1. Persistence % of degree and/or transfer-seeking students tracked for six years who enrolled in the first three consecutive terms. Research shows that students with sustained enrollment are more likely to succeed. MSJC AY09-10 Cohort Comparison 80.0% Overall Remedial College Prepared 78.0% 74.0% 76.0% 75.9% 72.0% 72.0% 71.4% 74.0% 74.6% 71.2% 72.9%73% 70.1% 72.0% 70.0% 69.7% 72.0% 70.0% 71.0% 68.0% 70.2% 67.4% 68.0% 66.0% 66.0% 64.0% 64.0% 62.0% 62.0% 60.0% 60.0% Persist Rate AY08-09 AY09-10 MSJC RCC San Bern. V. C.O.D. Crafton Hills Palomar 113 CCC Note: Consist of 1st time students with at least 6 units earned who attempted any Math or English in the first 3 years
2. At least 30 Units % of degree and/or transfer seeking students tracked for six years who achieved at least 30 units Credit accumulation, 30 units specifically, tend to be positively correlated with completion MSJC AY09-10 Cohort Comparison 70.0% Overall Remedial College Prepared 68.0% 66.0% 68.0%67.6% 66.0% 64.0% 63.4% 61.6% 65.1% 64.0% 61.0% 62.0% 63.8% 61.4% 63.5% 60.9% 62.0% 60.0% 60.0% 57.8% 60.9% 58.0% 58.0% 56.0% 57.5% 56.0% 54.0% 54.0% 52.0% 52.0% 50.0% 30 Units Rate AY08-09 AY09-10 MSJC RCC San Bern. V. C.O.D. Crafton Hills Palomar 113 CCC Note: Consists of 1st time students with at least 6 units earned who attempted any math or English in the first three years
3. Completion % of degree and/or transfer-seeking students tracked for six years who completed a degree, certificate or transfer related outcomes AY09-10 Cohort Completion Rate Comparison MSJC Overall Remedial College Prepared 55.0% 70% 53.4% 65% 50.0% 64% 62% 60% 47.1% 45.0% 55% 50% 40.0% 41.3% 45% 39.5%40.4% 40.1% 41% 40% 40% 36% 35.0% 36% 35% 35.4% 30% 30.0% 25% Completion Rate AY08-09 AY09-10 MSJC RCC San Bern. V. C.O.D. Crafton Hills Palomar 113 CCC Note: Consist of 1st time students with at least 6 units earned who attempted any math or English in the first three years
Remedial Cohorts Students tracked for six years who started below transfer level in English, Math, and/or ESL The cohort is defined as the year the student first attempts a course at any level below transfer. AY09-10 COMPARISON COHORTS 7,000 5,843 6,000 5052 5,000 3,406 4,000 3,047 3072 COHORT HEADCOUNT 3,000 2375 2,297 2,269 2,045 2060 1,821 1,502 1570 2,000 1293 877 875 748 1,000 313 279 223 141 126 68 0 0 MSJC 08-09 MSJC 09-10 RCC SAN BERN. V. C.O.D. CRAFTON HILLS PALOMAR 113 CCC AVERAGE ENGL MATH ESL
4. Remedial % of credit students tracked for six years who started below transfer level in English, math, and/or ESL and completed a college-level course in the same discipline AY09-10 Transition Rate English Math ESL 50.2% 43.3% 43.1% 40.7% 39.9% 38.5% 36.0% 36.2% 35.0% 32.8% 32.2% 31.1% 29.1% 28.6% 24.6% 23.8% 23.8% 23.8% 14.7% 9.9% 0.0% MSJC 08-09 MSJC 09-10 RCC San Bern. V. C.O.D. Crafton Hills Palomar
Career Technical Education Cohort Size(CTE) Count of students tracked for six years who completed 8 units classified as career technical education in a single discipline. Unduplicated first-time CTE cohorts each year. AY09-10 COMPARISON COHORTS 3,500 3,072 3,000 2,369 2,500 2,000 COHORT HEADCOUNT 1,429 1,425 1,245 1,242 1,500 1,000 752 327 500 0 MSJC 08-09 MSJC 09-10 RCC SAN BERN. V. C.O.D. CRAFTON HILLS PALOMAR 113 CCC AVERAGE Note: Consists of students who Completed a CTE course for the 1st time & completed more than 8 units in the subsequent three years in a single discipline (vocational TOP code & at least 1 course is occupational)
5. Career Technical Education (CTE) % of students tracked for six years through 2011-12 who completed several courses classified as career technical education in a single discipline & completed a degree, certificate or transferred AY08-09 Cohort CTE complete Rate Comparison 60.0% 55.0% 55.1% 51.7% 51.4% 51.4% 50.0% 51.0% 50.6% 49.3% 47.1% 45.0% 40.0% 35.0% CTE Completion Rate MSJC 08-09 MSJC 09-10 RCC San Bern. V. C.O.D. Crafton Hills Palomar 133 CCC Note: Consists of students who Completed a CTE course for the 1st time & completed more than 8 units in the subsequent three years in a single discipline (vocational TOP code & at least 1 course is occupational)
Thank you for your attention. Any Questions ??? For a copy of the presentation: nmesaris@msjc.edu Link to scorecard: http://scorecard.cccco.edu/scorecardrates.aspx?CollegeID=941


")
")