Study on Physical Activity and Incidence of Type 2 Diabetes in Multi-Ethnic Population
This study investigated the impact of physical activity on Type 2 Diabetes incidence in a diverse population. It found that weight loss and moderate/vigorous activity reduced risk, while sedentary behavior increased risk. The research involved over 6,800 participants without clinical CVD, spanning different ethnic backgrounds and genders. Laboratory assays were conducted to analyze serum glucose and insulin levels. The study aimed to determine how different activities affect diabetes risk and whether these effects vary across race and gender.

Download Presentation

Please find below an Image/Link to download the presentation.
The content on the website is provided AS IS for your information and personal use only. It may not be sold, licensed, or shared on other websites without obtaining consent from the author. If you encounter any issues during the download, it is possible that the publisher has removed the file from their server.
You are allowed to download the files provided on this website for personal or commercial use, subject to the condition that they are used lawfully. All files are the property of their respective owners.
The content on the website is provided AS IS for your information and personal use only. It may not be sold, licensed, or shared on other websites without obtaining consent from the author.
E N D
Presentation Transcript
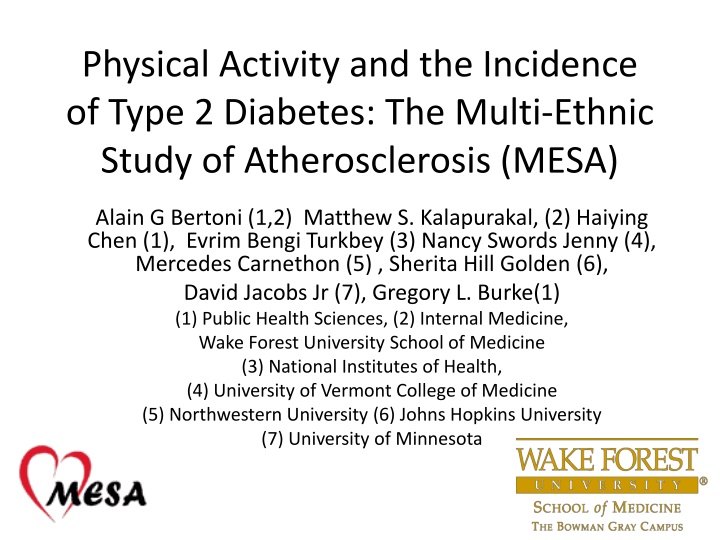
Physical Activity and the Incidence of Type 2 Diabetes: The Multi-Ethnic Study of Atherosclerosis (MESA) Alain G Bertoni (1,2) Matthew S. Kalapurakal, (2) Haiying Chen (1), Evrim Bengi Turkbey (3) Nancy Swords Jenny (4), Mercedes Carnethon (5) , Sherita Hill Golden (6), David Jacobs Jr (7), Gregory L. Burke(1) (1) Public Health Sciences, (2) Internal Medicine, Wake Forest University School of Medicine (3) National Institutes of Health, (4) University of Vermont College of Medicine (5) Northwestern University (6) Johns Hopkins University (7) University of Minnesota
Acknowledgement This research was supported by contracts N01-HC- 95159 through N01-HC-95165 and N01-HC-95169 from the National Heart, Lung, and Blood Institute. The authors thank the other investigators, the staff, and the participants of the MESA study for their valuable contributions. A full list of participating MESA investigators and institutions can be found at http://www.mesa-nhlbi.org
Background Weight loss, increased moderate/vigorous intensity PA (MVPA) reduces short-term incidence of T2DM in high risk participants MPVA is consistently inversely associated with T2DM risk Sedentary activity (e.g. television) is positively associated with T2DM risk Prior studies often conducted only in men or women, or did not include non-whites
Objective To investigate the differential associations of different PA and sedentary measures on incident T2DM in a large, contemporary multi-ethnic population Determine the extent to which these associations are similar across race and/or gender groups.
Multi-Ethnic Study of Atherosclerosis 6814 participants aged 45-84 years without clinical CVD were identified from 6 field centers in 2000- 2002 Forsyth County (NC), Baltimore, New York, Los Angeles, Chicago, and St. Paul (MN), USA 53% Female; 38% white 12% Chinese 28% black, 22% Hispanic Standard questionnaires and examination protocols used to determine anthropometric measures, medical history and medications, blood pressure
Laboratory Assays Participants reported to clinic after overnight (8+ hours) fast, phlebotomy performed and blood sent to central laboratories for analysis. Serum glucose measured by rate reflectance spectrophotometry using the glucose oxidase method on the Vitros analyzer (Johnson & Johnson Clinical Diagnostics) Serum Insulin determined by a radioimmunoassay method using the Linco Human Insulin Specific RIA Kit (Linco Research).
Physical Activity Survey 27 questions about activities 1 question about usual walking pace
Physical Activity Survey Time for each activity multiplied by activity specific Metabolic Equivalent (MET) value , then summed by light/moderate/ vigorous intensity categories. Derived variables: Moderate plus Vigorous PA MET-hours/wk Intentional exercise MET-hrs/wk sum of walking for exercise, sports/dancing, and conditioning Sedentary activities sum of television, non-work computer, reading, sewing, and do-nothing time
Incident Diabetes 2003 ADA definition: use of hypoglycemic meds or insulin or glucose > 7.0mmol/l (126mg/dl) Incidence at exam 2 (2003-04), 3 (2004-05) and 4 (2005-07) defined among those who did not have diabetes at baseline Assume Type 2 Diabetes
Statistical Analysis Final study sample 5,557 individuals excluded 857 (12.5%) baseline DM 24 (0.4%) missing baseline DM status 349 (5.1%) no follow-up, 14 (0.2%) no PA Data PA distribution skewed, categorized into quartiles except vigorous (none vs. any) Person-time analysis to calculate incidence rates Cox proportional hazards modeling to estimate risk associated with PA categories
Baseline Characteristics I White Chinese African American Hispanic N=2344 N=644 N=1434 N=1155 Characteristic 62 (10) 61(10) 62 (10) 61(10) Age 52% 52% 56% 53% Female 11% 5% 18% 14% Current Smoking 51% 41% 36% 11% Education >Bachelors 27.5 (4.9) 23.9 (3.3) 29.8 (5.8) 29.1 (4.8) BMI (kg/m2) 37% 34% 55% 37% Hypertension
Baseline Characteristics II African American White Chinese Hispanic Characteristic N=2344 N=644 N=1434 N=1155 88 (10) 92 (10) 90 (11) 91 (11) Glucose (mg/dl) 12% 20% 18% 19% Impaired Fasting Glucose 29% 26% 42% 41% DM Family History*
Physical Activity at Baseline Median MET-Hours Per Week 90 77 77 80 72 70 60 46 50 40 29 25 30 21 21 18 16 12 20 11 10 0 0 0 0 0 Moderate + Vigorous Sedentary Activity Mod-Vig Exercice Vigorous Leisure White Chinese Black Hispanic
Physical Activity at Baseline White Chinese African American Hispanic Physical Activity N=2344 41% N=644 26% N=1434 30% N=1155 27% Any Vigorous PA Walking Pace Walking <2mph Average Pace Walking >4mph 19% 51% 30% 21% 62% 17% 35% 42% 23% 28% 55% 17%
Incident DM: 418 persons (16.8/1000 PY) Rate per 1000 PY 30 25 22.4 22.2 20 16.2 15 11.1 10 5 0 White Chinese Black Hispanic
Diabetes Incidence by PA 30 24 25 20 No Vigorous Any Vigorous None/Casual Average Fast Per 1000 PY . 20 16 15 12 12 10 5 0 Vigorous PA Typical Walking Pace p<0.001 by Log Rank Test p<0.001 by Log Rank Test
Diabetes Incidence by PA Quartile1 Quartile 2 Quartile 3 Quartile4 25 21 21 21 20 20 Per 1000 PY . 17 17 16 15 14 14 15 13 13 10 5 0 Moderate+Vigorous Exercise Sedentary Activity p<0.05 by Log Rank Test except Exercise: p<0.001
Adjusted Hazards for DM incidence Hazards Ratio Model 1 1.0 0.71 (0.57-0.89) 0.61 (0.46-0.82) 1.0 1.07 (0.84-1.37) 0.74 (0.56-0.98) 0.69 (0.51-0.92) 1.00 1.12 (0.84, 1.49) 1.22 (0.91-1.64) 1.49 (1.12-1.97) 1.0 0.62 (0.49-0.79) Model 3* 1.0 0.89 (0.71-1.11) 0.93 (0.69-1.25) 1.0 1.17 (0.14-1.50) 0.88 (0.67-1.17) 0.91 (0.68-1.22) 1.00 1.03 (0.78-1.37) 1.13 (0.84-1.52) 1.24 (0.93-1.64) 1.0 0.75 (0.59-0.96) Activity type none or casual average Walking Pace brisk or striding Quartile 1 Quartile 2 Quartile 3 Exercise PA Quartile 4 Quartile 1 Quartile 2 Quartile 3 Sedentary Activity Quartile 4 None Vigorous PA Any Model 1=age, gender, race, education, site, smoking, anti-HTN med, SBP Model 2=Model 1+ bmi Model 3= Model 2+ homa-IR (insulin mU/L *(glucose mg/dl*0.055))/22.5) * potentially adjusting for variables in causal pathway
Exercise and Gender Interaction Exercise Quartiles and Incident DM Rates 30 25 20 15 10 5 0 Female Q1 Q2 Q3 Q4 Male Q1 Q2 Q3 Q4 Exercise PA (vs. Quartile 1) Women Men Model 1 0.40 (0.24, 0.65) 0.98 (0.66, 1.45) Model 3 0.58 (0.40, 0.95) 1.23 (0.83, 1.84) Quartile 4 Quartile 4 Model 1=age, gender, race, education, site, smoking, anti-HTN med, SBP Model 3= Model 1+ BMI + homa-IR (insulin mU/L *(glucose mg/dl*0.055))/22.5) * potentially adjusting for variables in causal pathway
Sedentary Activity and Race/Ethnicity Sedentary Activity Quartiles and DM Incidence Rates 45 40 35 30 25 20 15 10 5 0 Sedentary Activity, Hazard Ratios (vs. Quartile 1) White Chinese Black Model 1 4.23 (2.19-8.15) 0.90 (0.38, 2.13) 0.99 (0.62-1.58) Model 3 2.35 (1.20-4.60) 0.55 (0.23, 1.32) 0.98 (0.61, 1.55) Quartile 4 Quartile 4 Quartile 4 Hispanic Quartile 4 1.35 (0.78, 2.36) 1.17 (0.67, 2.03)
Several PA constructs modeled simultaneously Hazards Ratio Activity type Model 1 1.0 Model 3 1.0 none or casual 0.75 (0.60-0.93) 0.69 (0.51-0.92) 1.0 1.16 (0.90-1.49) 0.84 (0.63-1.11) 0.80 (0.60-1.08) 1.0 1.15 (0.86-1.53) 1.24 (0.92-1.66) 1.46 (1.10-1.94) 1.0 0.68 (0.51-0.92) 0.90 (0.72-1.14) 0.98 (0.72-1.33) 1.0 1.21 (0.94-1.55) 0.92 (0.69-1.22) 0.96 (0.71-1.30) 1.0 1.04 (0.78-1.38) 1.14 (0.84-1.53) 1.25 (0.94-1.66) 1.0 0.77 (0.59-0.99) average Walking Pace brisk or striding Quartile 1 Quartile 2 Quartile 3 Exercise PA Quartile 4 Quartile 1 Quartile 2 Quartile 3 Sedentary Activity Quartile 4 None Vigorous PA Any Model 1=age, gender, race, education, site, smoking, anti-HTN med, SBP Model 3= Model 1+bmi + homa (potential mediators)
Stratification by Vigorous PA No vigorous PA (N=3719): exercise level, walking pace associated with risk of T2DM; sedentary activities not significant Quartile 4 exercise HR 0.66 (95%CI 0.45-0.96) Fast pace walking HR 0.63 (95% CI 0.44-0.90) Some vigorous PA (N=1872): exercise, walking pace not associated with DM, sedentary activity associated with T2DM Quartile 4 sedentary HR 2.23 (95%CI 1.23, 4.03)
Conclusions Several PA measures associated with incident T2DM in multi-ethnic sample of U.S. adults Potentially mediated by obesity and insulin resistance Any vigorous PA remained protective against incident T2DM, independent of other PA constructs, potential confounders, and baseline BMI, and insulin resistance
Implications Promotion of vigorous PA in public health recommendations and clinical interventions aimed at preventing T2DM for those able to perform it non-white groups had higher T2DM incidence, reported less participation in vigorous PA Encourage moderate intensity exercise among those not partaking in vigorous PA If walking, best at a brisk pace Decreased time in sedentary activities for all


")