Study Participant Baseline Details, Medication and Health Parameters
Explore the baseline demographics, medications, 24h blood pressure changes, echo parameters pre and post-ROX Coupler, as well as CPET parameters at baseline and 6 months post-ROX Coupler. Additionally, discover the results of prespecified models based on specific outcomes for the study participants.

Download Presentation

Please find below an Image/Link to download the presentation.
The content on the website is provided AS IS for your information and personal use only. It may not be sold, licensed, or shared on other websites without obtaining consent from the author. If you encounter any issues during the download, it is possible that the publisher has removed the file from their server.
You are allowed to download the files provided on this website for personal or commercial use, subject to the condition that they are used lawfully. All files are the property of their respective owners.
The content on the website is provided AS IS for your information and personal use only. It may not be sold, licensed, or shared on other websites without obtaining consent from the author.
E N D
Presentation Transcript
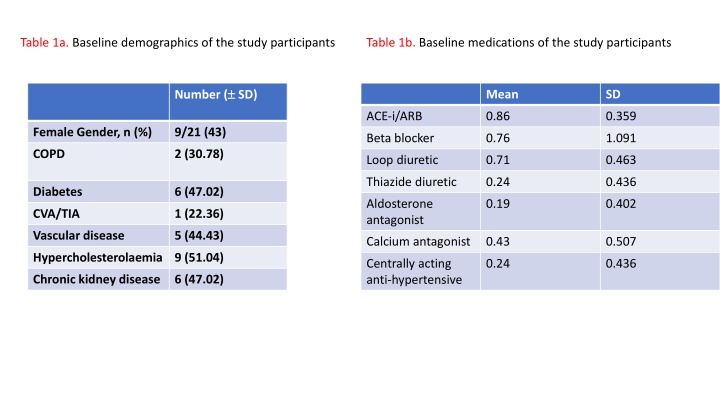
Table 1a. Baseline demographics of the study participants Table 1b. Baseline medications of the study participants Number ( SD) Mean SD ACE-i/ARB 0.86 0.359 Female Gender, n (%) 9/21 (43) Beta blocker 0.76 1.091 COPD 2 (30.78) Loop diuretic 0.71 0.463 Thiazide diuretic 0.24 0.436 Diabetes 6 (47.02) Aldosterone antagonist 0.19 0.402 CVA/TIA 1 (22.36) Vascular disease 5 (44.43) Calcium antagonist 0.43 0.507 Hypercholesterolaemia 9 (51.04) Centrally acting anti-hypertensive 0.24 0.436 Chronic kidney disease 6 (47.02)
Figure 1. Change in 24h BP throughout the study period. Error bars represent the standard error of mean. 180 160 p=0.001 140 120 Blood pressure (mmHg) 100 p=0.0001 p=0.0001 80 60 40 20 0 Baseline 1 Day 6 Months Systolic BP Diastolic BP
Table 2a. Echo parameters at baseline and 6 months post-ROX Coupler Baseline 6 Months Post-ROX P Value Doppler SV (mL) 76.4 (12.2) 92.1 (22.7) 0.002 RV S (cm/s) 17.1 (3.9) 17.2 (4.0) 0.29 Septal E/E 11.1 (3.2) 10.8 (3.7) 0.85 Lateral E/E 13.0 (22.7) 8.5 (3.8) 0.91
Table 2b. CPET parameters at baseline and 6 months post-ROX Coupler Baseline 6 Months Post-ROX P Value VO2 Peak Power (W) 18.1 (4.7) 17.0 (4.8) ns 113.6 (49.9) 105.8 (57.0) ns VE/VCO2 33.9 (8.5) 37.1 (6.3) ns
Table 3 Results of prespecified models by outcome Name Post Increased diuretic requirement (baseline) Increased diuretic requirement*Post VO2 peak -0.588 (95% CI -2.123 to 0.948; p=0.433) -1.909 (95% CI -6.912 to 3.094; p=0.434) -2.213 (95% CI -5.359 to 0.934; p=0.157) Power -2.500 (95% CI -9.145 to 4.145; p=0.441) -29.425 (95% CI -84.735 to 25.885; p=0.279) -22.500 (95% CI -36.118 to -8.882; p=0.003) VE/VCO2 2.488 (95% CI -1.469 to 6.444; p=0.203) 1.594 (95% CI -7.079 to 10.268; p=0.704) 2.812 (95% CI -5.857 to 11.481; p=0.504) RV S 0.938 (95% CI -0.890 to 2.765; p=0.296) 2.563 (95% CI -1.672 to 6.797; p=0.221) -3.138 (95% CI -6.883 to 0.608; p=0.096) Doppler SV 17.013 (95% CI 7.304 to 26.721; p=0.002) -0.459 (95% CI -20.427 to 19.508; p=0.962) -4.175 (95% CI -24.072 to 15.721; p=0.665) E/E lateral -0.117 (95% CI -2.157 to 1.924; p=0.906) 2.911 (95% CI -1.047 to 6.868; p=0.140) -1.690 (95% CI -5.872 to 2.492; p=0.408) E/E septal 0.142 (95% CI -3.643 to 3.926; p=0.938) -0.631 (95% CI -4.530 to 3.269; p=0.739) -0.171 (95% CI -2.073 to 1.732; p=0.853)