Success in African Business: Insights and Opportunities
In this research overview, delve into the challenges and opportunities facing companies in East Africa, focusing on high growth indicators, barriers to firm growth, institutional factors, and implications for companies aiming to enter the African market.

Download Presentation

Please find below an Image/Link to download the presentation.
The content on the website is provided AS IS for your information and personal use only. It may not be sold, licensed, or shared on other websites without obtaining consent from the author.If you encounter any issues during the download, it is possible that the publisher has removed the file from their server.
You are allowed to download the files provided on this website for personal or commercial use, subject to the condition that they are used lawfully. All files are the property of their respective owners.
The content on the website is provided AS IS for your information and personal use only. It may not be sold, licensed, or shared on other websites without obtaining consent from the author.
E N D
Presentation Transcript
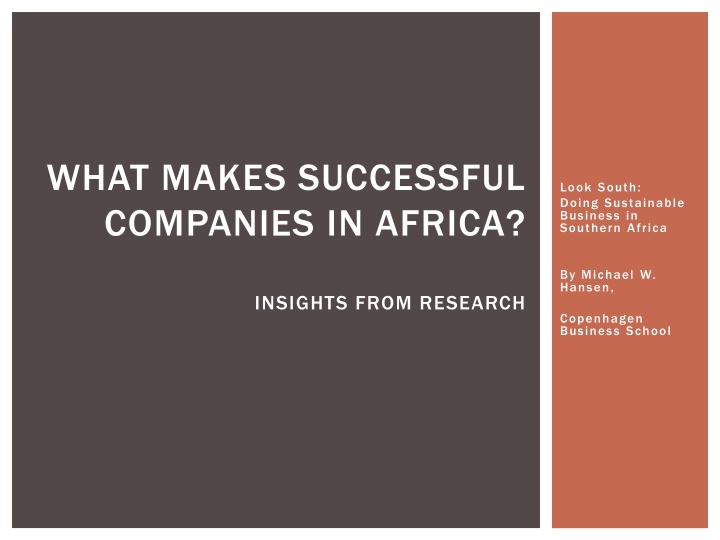
WHAT MAKES SUCCESSFUL COMPANIES IN AFRICA? Look South: Doing Sustainable Business in Southern Africa By Michael W. Hansen, INSIGHTS FROM RESEARCH Copenhagen Business School
OVERVIEW OF PRESENTATION Purpose of Purpose of presentation What do we know about performance of companies in Africa? What are implications for companies considering to enter Africa? presentation Topics Topics What are the challenges and opportunities in Africa? Why are Danish companies entering Africa? How are Danish companies entering Africa? How are Danish companies in Africa performing? Conclusion: What creates success in Africa? Sources Sources 2011 IFU survey of 200 Danish investments in Africa 2015 survey of 172 local companies in Tanzania and Kenya
WHAT ARE THE CHALLENGES AND OPPORTUNITIES IN EAST AFRICA? Opportunities High growth Indicator Indicator GDP GDP (constant (constant 2011 $ $) ) GDP GDP growth growth (annual Kenya Kenya 2009: 2,405 2014: 2,818 for local companies? for local companies? Tanzania Tanzania 2009: 2,049 2014: 2,421 growth for local per per capita, capita, international What are the main barriers to firm What are the main barriers to firm growth for local companies? companies? PPP PPP Pent up demand 2011 international What are the main What are the main institutional barriers to firm institutional barriers to firm growth growth Low competition (annual % %) ) 2010: 8.4 2011: 6.1 2012: 4.6 2013: 5.7 2014: 5.3 2010: 6.4 2011: 7.9 2012: 5.1 2013: 7.3 2014: 7.0 Vast resources High input costs/no access to inputs Inadequate infrastructure Challenges Corruption Average Average (calculated) (calculated): : Weak industrial environment Institutional factors 6.02 2009: 20.0 2014: 16.4 6.74 2009: 17.4 2014: 19.5 De-industrialization and missing middle Exports Exports of of goods ( (% % of of GDP) GDP) Government bodies - goods and linkages and services services Weak business networks and Lack of competence among Tanzania Kenya Tanzania Problems of accessing inputs Insufficient/lacking Under-developed supporting industries Foreign Foreign net net inflows inflows ( (% % of of GDP) Inadequate government regulation and enforcement direct direct government support investment, investment, GDP) 2009: 0.3 2014: 1.5 2009: 3.3 2014: 4.3 Other Institutional voids Corruption direct direct Unfair competition Kenya Foreign Foreign net net outflows outflows ( (% % of of GDP) Lack of competence among government bodies - locally investment, investment, GDP) 2009: 0.1 2014: -0.1 2009: 2014: No data available 2005: 1,318.3 2010: 1,991.7 30% 40% Deficent contract environment and weak infrastructures Poor Infrastructure Manufacturing Manufacturing value (MVA) (MVA)performance performance Weak role of business association value added added 2005: 1,522.5 2010: 1,882.2 0% 10% 20% 50% Implications for companies wishing to enter Africa Manufacturing/ Manufacturing/ GDP GDP 2007: 14% 2014: 11% 2009: 82 2014: 129 2015: 108 2007: 8% 2014: 6% 2009: 127 2014: 140 2015: 139 0.00% 10.00% 20.00% 30.00% Ease Ease of of doing (Rank (Rank: :1 1 to to 189 doing business business index 189) ) index Opportunities for first mover advantages and windfall earnings Challenges related to lack of inputs, weak support industries, and institutional voids
WHY ARE DANISH COMPANIES INVESTING IN AFRICA? Companies internationalize for essentially four reasons Access resources Access markets Share of Share of Danish investors Danish investors motivated with market access access motivated with market Reduce costs Access assets All Asia Motives in Africa Central and Eastern Europe Mainly market seeking, in BtB and BtG markets, rarely BtC markets Latin America Middle East and North Africa Rarely cost reduction motivated West Africa Southern Africa (ex ZAF) Implications for companies wishing to enter Africa South Africa East Africa Companies are almost all market seeking, mainly in BtB markets 0.00% 50.00% 100.00% Only a few companies seem to engage in local sourcing and production, however this may change in the longer run.
HOW ARE DANISH INVESTORS ENTERING AFRICA? Multiple entry modes possible Pure Pure market market Contractual Contractual entry entry Joint Joint venture venture ( (equity equity) ) Acquisition Acquisition Fully Fully Depends on transaction costs and capability factors DECIDING ON ENTRY MODE entry entry controlled controlled Share of Danish investors having 100% ownership of Share of Danish investors having 100% ownership of project project Agent Distributor Export Franchise Sales and service JV Acquisition of sales and service organization Sales and service subsidiary Market seeking In Africa, local partnerships remain relatively common Asia Acquisition of local company Acquisition of producer Fully controlled subsidiary Import License Outsourcing Production JV Soucing office Production subsidiary Transaction Production oriented Central and Eastern Europe costs (IPR protection, contract enforcement, uncertainty, complexity) Difficult business environments Latin America License/ franchise Joint venture Need to buy into local competencies Middle East and North Africa West Africa Export Local purchase of inputs Implications for companies wishing to enter Africa Southen Africa East Africa Need for complementary resources Rarely 100% equity entry, often non- equity 0.00% 10.00% 20.00% 30.00% 40.00% 50.00% 60.00% (Market knowledge, networks, access to authorities, access to local labor, cultural intelligence) Local partnerships are essential, e.g. agents, distributors and JVs There is no right mode, it depends on the balance of transaction cost and capability factors
HOW ARE DANISH INVESTORS IN AFRICA PERFORMING? Local and Danish companies in Africa are relatively profitable Performance of Danish investors in Africa Performance of Danish investors in Africa Performance in Africa and size Performance in Africa and size Danish investor performance over time Danish investor performance over time 70.00% 90.00% Relatively many Danish companies fail in Africa and many have low IRR 80.00% 60.00% 70.00% All 50.00% 60.00% Asia 50.00% 40.00% 40.00% However, huge improvements in performance of Danish investors in Africa over time Stop of operation Stop of operation Central and Eastern Europe 20.00% 30.00% 30.00% Negative IRR Negative IRR Negative IRR 20.00% 10.00% Latin America 0.00% 10.00% Middle East and North Africa 0.00% Small firms Stop of operation Large fims succeed more, mediumsized companies are challenged Medium sized firms Large firms up to 1000 More than 1000 West Africa Southern Africa (ex ZAF) Implications for companies wishing to enter Africa South Africa Prospects of large earnings East Africa Risks are large (but declining) 0.00% 20.00% 40.00% 60.00% 80.00% Some companies are able to contain risk: How?
SO, WHAT CREATES SUCCESS IN AFRICA? Highly profitable investments are possible in Africa Khanna Khanna and and Palepu Palepu winning emerging emerging markets winning strategies strategies in markets in But the challenges and risks related to the business environment are also very high Accessing inputs Dealing with institutional voids and deficient infrastructures Finding partners Replicate or adapt business models, products, etc. Compete alone or acquire capabilities? JV with local partner Many companies have very good performance, hence the challenges and risks of the business environment can be contained Accept market context as given or change through own initiatives There is probably not one-size-fits-all strategy to contain business environment challenges and risks. Enter/stay despite institutional voids or seek opportunities in alternative locations/markets Instead each company must analyze on various strategy dimensions to identify its best strategy (Khanna and Palepu, 2010).
OVERALL FINDINGS REGARDING DANISH INVESTORS High risks but also high returns for MNC subsidiaries Implication: The return/risk profile may reflect adverse selection in the sense that MNCs only invest in high return projects in developing countries The level of variance in performance has been falling over time Implication: We witness a certain degree of mainstreaming of performance e.g. due to improved capabilities of MNCs, improved business environments, or improved screening ability of financial markets. The variance is consistently explained better by firm capability/ strategy factors than by external factors. Implication: MNCs with strong capabilities and/or MNCs adopting the right strategies can overcome adversities of developing country and industry environments. It is factors within the control of the MNC that largely determines performance. Achieving high performance has over time moved from being externally determined to being internally determined