Suicide and Mental Health Trends Among Arkansas Youth
Explore the latest data on suicide and mental health issues among youth in Arkansas, highlighting disparities and myths to dispel. Learn about the Arkansas Prevention Needs Assessment Survey findings and the importance of access to counseling services in schools.
Download Presentation

Please find below an Image/Link to download the presentation.
The content on the website is provided AS IS for your information and personal use only. It may not be sold, licensed, or shared on other websites without obtaining consent from the author. If you encounter any issues during the download, it is possible that the publisher has removed the file from their server.
You are allowed to download the files provided on this website for personal or commercial use, subject to the condition that they are used lawfully. All files are the property of their respective owners.
The content on the website is provided AS IS for your information and personal use only. It may not be sold, licensed, or shared on other websites without obtaining consent from the author.
E N D
Presentation Transcript
Suicide and Mental Health Among Arkansas Youth Austin Porter, DrPH, MPH
Objectives Review and analyze trends associated with suicide and suicidal ideation among Arkansas youth Discuss disparities that may be associated with mental health 2
Data Sources Arkansas Prevention Needs Assessment Youth Risk Behavior Survey Arkansas Department of Health Vital Records Hospital Discharge Dataset 3
Myths Black people don t commit suicide Black people don t need to seek therapy Therapists make matters worse 4
Public Health Threat Need to dispel myths Black youth are at risk 5
Arkansas Prevention Needs Assessment Survey Respondent Demographics, 2020-2021 Variable N = 100,407 Age in years mean, (std. dev.) 14.0, (2.1) Gender n, (%) Male 47,021 (46.8%) Female 47,505 (47.3%) Missing 5,881 (5.9%) Grade n, (%) 6th 30,068 (30.0%) 8th 30,029 (29.9%) 10th 23,751 (23.7%) 12th 16,559 (16.5%) 7
Arkansas Prevention Needs Assessment Survey Respondent Demographics, 2020-2021 Variable N = 100,407 Race n, (%) Alaskan Native 69 (0.1%) American Indian 1,607 (1.6%) Asian 1,670 (1.7%) Black 13,894 (13.8%) Other 15,850 (15.8%) Pacific Islander 1,663 (1.7%) White 63,382 (63.1%) Missing 2,272 (2.3%) 8
Have Enough Access to School Counseling Services, 2020-2021 (Counselors who can help with mental health, feelings, or problems) 60 50.1 50 Percent of respondents 40 30 22.7 20 12.2 10 0 Yes No I don't know Source: Arkansas Prevention Needs Assessment Survey Note: 15.1% of respondents missing 9
Felt Nervous in the Past 30 Days, 2020-2021 25 22.8 20 18.1 16.7 Percent of respondents 15.7 15 13.3 10 5 0 All of the time Most of the time Some of the time A little of the time None of the time Source: Arkansas Prevention Needs Assessment Survey Note: 13.3% of respondents missing 10
Felt Hopeless in the Past 30 Days, 2020-2021 40 35.7 35 30 Percent of respondents 25 20 14.9 14.8 15 11.6 9.1 10 5 0 All of the time Most of the time Some of the time A little of the time None of the time Source: Arkansas Prevention Needs Assessment Survey Note: 13.9% of respondents missing 11
Felt Restless in the Past 30 Days, 2020-2021 30 24.5 25 Percent of respondents 20 18.8 16 14.2 15 12.4 10 5 0 All of the time Most of the time Some of the time A little of the time None of the time Source: Arkansas Prevention Needs Assessment Survey Note: 14.1% of respondents missing 12
Felt Depressed in the Past 30 Days, 2020-2021 (So depressed that nothing could cheer you up) 45 41.5 40 35 Percent of respondents 30 25 20 14.1 15 12.5 10.2 10 8 5 0 All of the time Most of the time Some of the time A little of the time None of the time Source: Arkansas Prevention Needs Assessment Survey Note: 13.8% of respondents missing 13
Felt Worthless in the Past 30 Days, 2020-2021 45 41.1 40 35 Percent of respondents 30 25 20 13.7 15 12.3 11 10 8.1 5 0 All of the time Most of the time Some of the time A little of the time None of the time Source: Arkansas Prevention Needs Assessment Survey Note: 13.8% of respondents missing 14
Felt Nervous All the Time in the Past 30 Days, 2020-2021, By Race 20 18.3 18 16.2 16.2 15.9 15.3 16 14.5 13.9 14 Percent of respondents 12 10 8 6 4 2 0 Alaskan Native American Indian Asian Black Other Pacific Islander White Source: Arkansas Prevention Needs Assessment Survey Note: 12.9% of respondents missing 16
Felt Hopeless All the Time in the Past 30 Days, 2020-2021, By Race 18 15.3 16 14.7 14 12.3 12.2 Percent of respondents 11.5 11.3 12 10.1 10 8 6 4 2 0 Alaskan Native American Indian Asian Black Other Pacific Islander White Source: Arkansas Prevention Needs Assessment Survey Note: 9.9% of respondents missing 17
Felt Restless All the Time in the Past 30 Days, 2020-2021, By Race 25 21.8 20.3 20 18.2 17.4 17.1 16.7 Percent of respondents 14.9 15 10 5 0 Alaskan Native American Indian Asian Black Other Pacific Islander White Source: Arkansas Prevention Needs Assessment Survey Note: 14.2% of respondents missing 18
Felt Restless All the Time in the Past 30 Days, 2020-2021, By Race 25 21.8 20.3 20 18.2 17.4 17.1 16.7 Percent of respondents 14.9 15 10 5 0 Alaskan Native American Indian Asian Black Other Pacific Islander White Source: Arkansas Prevention Needs Assessment Survey Note: 14.2% of respondents missing 19
Felt Depressed All the Time in the Past 30 Days, 2020-2021, By Race (So depressed that nothing could cheer you up) 16 14.5 13.8 14 12.9 12 11.3 Percent of respondents 10.1 9.9 10 8.9 8 6 4 2 0 Alaskan Native American Indian Asian Black Other Pacific Islander White Source: Arkansas Prevention Needs Assessment Survey Note: 8.3% of respondents missing 20
Felt Worthless All the Time in the Past 30 Days, 2020-2021, By Race 18 17 16 15.2 14.3 14.1 13.8 14 12.2 Percent of respondents 11.6 12 10 8 6 4 2 0 Alaskan Native American Indian Asian Black Other Pacific Islander White Source: Arkansas Prevention Needs Assessment Survey Note: 12.0% of respondents missing 21
High School Students Who Made a Suicide Plan in Past 12 Months, Arkansas vs. United States, 2013-2019 30 26.1 25 20 Percent of respondents 17.9 16.7 16.5 15.7 14.6 15 13.6 13.6 10 5 0 2013 2015 2017 2019 Arkansas United States Source: Youth Risk Behavior Survey 23
High School Students Who Made a Suicide Plan in Past 12 Months, Arkansas, By Race, 2013-2019 40 34.7 35 30 26.5 25.8 Percent of respondents 25 23.2 19.4 20 21.1 16.5 16.5 17.8 15 16.1 15.2 14 10 5 0 2013 2015 2017 2019 Black Hispanic White Source: Youth Risk Behavior Survey 24
High School Students Who Attempted Suicide in Past 12 Months, Arkansas vs. United States, 2013-2019 18 15.8 16 14 12.1 11.5 12 Percent of respondents 10.8 10 8.9 8.6 8 7.4 8 6 4 2 0 2013 2015 2017 2019 Arkansas United States Source: Youth Risk Behavior Survey 25
High School Students Who Attempted Suicide in Past 12 Months, Arkansas, By Race, 2013-2019 20 18.5 18 17.7 15.3 16 15 16.5 14.1 14 12.8 Percent of respondents 11.3 12 11 11.3 10 9.5 9.4 8 6 4 2 0 2013 2015 2017 2019 Black Hispanic White Source: Youth Risk Behavior Survey 26
High School Students Who Considered Suicide in Past 12 Months, Arkansas vs. United States, 2013-2019 25 23.2 19.7 19 20 18.9 18.8 17.2 17 17.7 Percent of respondents 15 10 5 0 2013 2015 2017 2019 Arkansas United States Source: Youth Risk Behavior Survey 27
High School Students Who Considered Suicide in Past 12 Months, Arkansas, By Race, 2013-2019 30 24.4 24.3 25 21.6 22.1 23.5 20.2 19.8 20 Percent of respondents 17.8 20.6 20.3 15.2 15 11.7 10 5 0 2013 2015 2017 2019 Black Hispanic White Source: Youth Risk Behavior Survey 28
Data Sources and Methodology Data sources Primary Source: Hospital Discharge Data System Arkansas Department of Health WISQARS, Centers for Disease Control and Prevention Methodology Injury codes are used from the Injury Matrix of ICD-10 injury diagnosis codes, provided by CDC using SAS Program Rehabilitation and psychiatric hospitals were excluded Hospitalization data in this profile was compiled using the county of residence Caveats regarding hospital discharge data Data may contain duplicate entries as individuals may be admitted and transferred to another hospital for complications from an injury Some cases contained an unknown Arkansas county of residence code these were included in the total case number Emergency Department Visit data are provisional 30
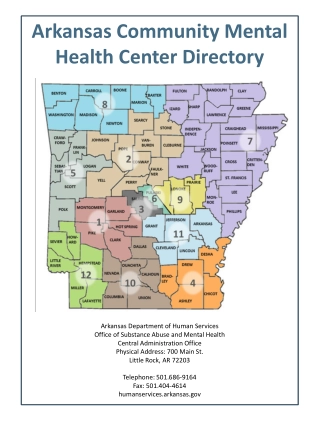
Arkansas Public Health Regions Carroll Fulton Randolph Clay Boone Benton Baxter Northwest Marion Sharp Izard Greene Lawrence Madison Washington Newton Searcy Craighead Stone Mississippi Independence Northeast Franklin Crawford Johnson Van Buren Jackson Cleburne Poinsett Pope Cross Conway White Logan Crittenden Woodruff Sebastian Faulkner St. Francis Perry Central Yell Scott Prairie Lee Pulaski Lonoke Saline Monroe Garland Phillips Montgomery Polk Jefferson Arkansas Hot Spring Grant Howard Southeast Pike Clark Sevier Dallas Lincoln Southwest Cleveland Desha Little River Hempstead Nevada Calhoun Ouachita Drew Bradley Miller Chicot Ashley Columbia Union Lafayette 31
Self-Inflicted Injury Emergency Department Visit Rates by Arkansas Public Health Region, Ages 0-19, 2016-2020 160.0 151.7 140.0 130.9 127.4 Age-specific rate per 100,000 113.4 120.0 111.6 2016 100.0 2017 77.8 80.0 2018 60.0 2019 2020 40.0 20.0 0.0 Central Northeast Northwest Southeast Southwest State Source: Hospital Discharge Data System, Arkansas Department of Health 32
Self-inflicted Injury Hospitalization Rates by Arkansas Public Health Region, Ages 0-19, 2016-2020 40.0 38.0 35.0 Age-specific rate per 100,000 30.0 27.9 26.9 24.6 2016 25.0 2017 20.0 16.9 2018 15.6 15.0 2019 2020 10.0 5.0 0.0 Central Northeast Northwest Southeast Southwest State Source: Hospital Discharge Data System, Arkansas Department of Health 33
Suicide Rates by Arkansas Public Health Region, Ages 0-19, 2016-2020 9.0 8.3 7.6 8.0 Age-specific rate per 100,000 7.0 6.0 2016 5.3 4.7 5.0 2017 4.2 2018 4.0 2019 3.0 2020 1.7 2.0 1.0 0.0 Central Northeast Northwest Southeast Southwest State Source: Vital Statistics, Arkansas Department of Health 34
Age Adjusted Suicide Rate Among Arkansans, By Race, 2015-2020 25 22.2 21.1 20 Age adjusted rate per 100,000 15 10.4 10 4.7 5 0 2015 2016 2017 2018 2019 2020 Black White Source: Vital Statistics, Arkansas Department of Health 35
Average Age of Decedents From Suicide, Arkansas, By Race, 2015-2020 60 50 47 47 44 40 Average age (years) 30 31 20 10 0 2015 2016 2017 2018 2019 2020 Black White Source: Vital Statistics, Arkansas Department of Health 36

