Survey of Developments in PNG - Commodity Prices, GDP, Tourism, and More
"Explore the latest survey of developments in Papua New Guinea covering growth in commodity prices, GDP trends, tourist arrivals, formal sector employment, exchange rates, and more. Gain insights into the economic landscape of PNG from 2014 to 2015."

Download Presentation

Please find below an Image/Link to download the presentation.
The content on the website is provided AS IS for your information and personal use only. It may not be sold, licensed, or shared on other websites without obtaining consent from the author. If you encounter any issues during the download, it is possible that the publisher has removed the file from their server.
You are allowed to download the files provided on this website for personal or commercial use, subject to the condition that they are used lawfully. All files are the property of their respective owners.
The content on the website is provided AS IS for your information and personal use only. It may not be sold, licensed, or shared on other websites without obtaining consent from the author.
E N D
Presentation Transcript
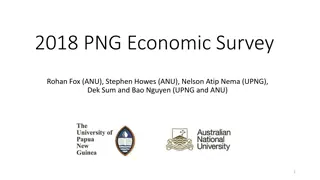
PNG Update: survey of developments, 2014-15 Michael Cornish, Rohan Fox, Stephen Howes, Win Nicholas, Albert Prabhakar and Ani Rova
Growth in commodity prices 2000-2020 (2000=100) 600 Est Projection 500 400 300 200 100 0 2000 2001 2002 2003 2004 2005 2006 2007 2008 2009 2010 2011 2012 2013 2014 2015 2016 2017 2018 2019 2020 Oil Copper Nickel Palm oil Coffee Logs
Japanese LNG contract prices (USD/bmmbtu) 18 Actual Projection 16 14 12 USD/bmmbtu 10 8 6 4 2 0
GDP and GDP per capita (2012 prices) 7,000 50 Kina Kina billion 45 6,000 40 5,000 35 30 4,000 25 3,000 20 15 2,000 10 1,000 5 0 0 GDP per capita (lhs) GDP (rhs)
Agricultural commodity production (volumes, 2001=100) 250 200 150 100 50 0 2001 2002 2003 2004 2005 2006 2007 2008 2009 2010 2011 2012 2013 2014 Cocoa Coffee Copra Palm oil
Annual tourist arrivals (by plane) to PNG 35,000 30,000 25,000 20,000 15,000 10,000 5,000 0 2000 2001 2002 2003 2004 2005 2006 2007 2008 2009 2010 2011 2012 2013
Formal sector employment growth (quarterly, year on year) 7 6 5 4 % 3 2 1 0 Sep-12 Dec-12 Mar-13 Jun-13 Sep-13 Dec-13 Mar-14 Jun-14 Sep-14 Dec-14
Fifteen most resource-dependent economies with floating exchange rates, and PNG
Foreign Exchange Reserves (millions $US) 4,500 4,000 3,500 3,000 2,500 2,000 1,500 1,000 500 0
Inflation 2012-2015 (quarterly, year on year) 7 6 5 4 % 3 2 1 0 Sep-12 Dec-12 Mar-13 Jun-13 Sep-13 Dec-13 Mar-14 Jun-14 Sep-14 Dec-14 Mar-15
Fiscal surpluses and deficits in PNG (% GDP) 2000 to 2014 4.0% 2.0% 0.0% -2.0% -4.0% -6.0% -8.0% -10.0%
PNG government revenue and expenditure (% GDP) 40% 38% 36% 34% 32% 30% 28% 26% 24% 1999 2000 2001 2002 2003 2004 2005 2006 2007 2008 2009 2010 2011 2012 2013 2014 Revenue Expenditure
PNG government revenue and expenditure (% GDP) 2014 actuals, 2015 budget, and 2016-18 forward estimates 38% 36% 34% 32% 30% 28% 26% 24% 22% 20% 2014 2015 2016 2017 2018 Revenue Expenses
Debt/GDP ratio 80% 70% 60% 50% 40% 30% 20% 10% 0%
Net debt by type (K million) 7,000 6,000 5,000 4,000 3,000 2,000 1,000 0 2011 2012 2013 2014 Treasury Bills Inscribed Stock International Agencies
Minimum wage in 2012 prices (K per week) 120 100 80 60 40 20 0 1993 1994 1995 1996 1997 1998 1999 2000 2001 2002 2003 2004 2005 2006 2007 2008 2009 2010 2011 2012 2013 2014
Funding for national road rehabilitation and maintenance


 to PNG")


")

")

")