Sustainability Data Trends Analysis
This report presents trends in sustainability data related to purchased electricity, natural gas usage, water consumption, paper production, and greenhouse gas emissions from fossil fuels across multiple years for Seaman Paper and Glatz Paper. The data covers metrics such as kWh usage, gallons of water per ton, tons of CO2e emissions, and more.

Download Presentation

Please find below an Image/Link to download the presentation.
The content on the website is provided AS IS for your information and personal use only. It may not be sold, licensed, or shared on other websites without obtaining consent from the author.If you encounter any issues during the download, it is possible that the publisher has removed the file from their server.
You are allowed to download the files provided on this website for personal or commercial use, subject to the condition that they are used lawfully. All files are the property of their respective owners.
The content on the website is provided AS IS for your information and personal use only. It may not be sold, licensed, or shared on other websites without obtaining consent from the author.
E N D
Presentation Transcript
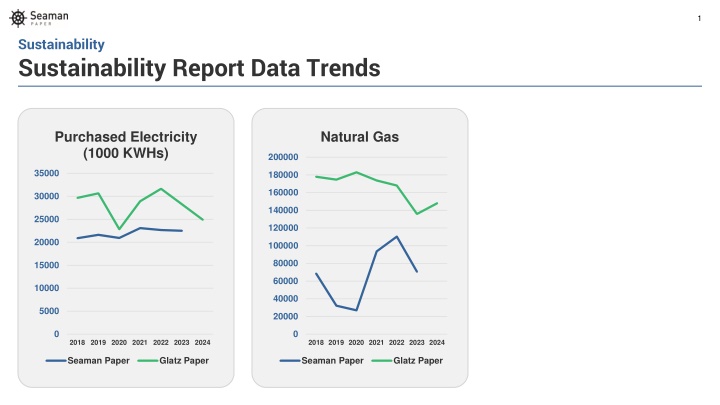
1 Sustainability Sustainability Report Data Trends Purchased Electricity (1000 KWHs) Natural Gas 200000 35000 180000 160000 30000 140000 25000 120000 20000 100000 80000 15000 60000 10000 40000 5000 20000 0 0 2018 2019 2020 2021 2022 2023 2024 2018 2019 2020 2021 2022 2023 2024 Seaman Paper Glatz Paper Seaman Paper Glatz Paper
2 Sustainability Sustainability Report Data Trends Water (Million Gallons) Production of Paper (Short Tons) Greenhouse Gas from Fossil Fuel (Tons of CO2e) 3000 45000 2500 40000 35000 35000 30000 2000 30000 25000 25000 1500 20000 20000 15000 1000 15000 10000 10000 500 5000 5000 0 2018 2019 2020 2021 2022 2023 2024 0 0 2018 2019 2020 2021 2022 2023 2024 2018 2019 2020 2021 2022 2023 2024 Seaman Paper Glatz Paper Seaman Paper Glatz Paper Seaman Paper Glatz Paper
3 Sustainability Sustainability Report Data Trends Purchased Electricity (KWH/Ton) Water (1000 Gallons/Ton) Fossil Fuel GHG 70 1 1200 0.9 60 0.8 1000 50 0.7 800 0.6 40 0.5 600 30 0.4 400 0.3 20 0.2 200 10 0.1 0 0 0 2018 2019 2020 2021 2022 2023 2024 2018 2019 2020 2021 2022 2023 2024 2018 2019 2020 2021 2022 2023 2024 Seaman Paper Glatz Paper Seaman Paper Glatz Paper Seaman Paper Glatz Paper
4 Sustainability Sustainability Report Data Trends (Otter River Mill) Purchased Electricity (1000 KWHs) Fuel #6 Oil (gallons) Fuel Wood (Short Tons) 120000 23500 33000 32500 100000 23000 32000 22500 31500 80000 31000 22000 30500 60000 21500 30000 21000 29500 40000 29000 20500 28500 20000 20000 28000 19500 0 27500 2018 2019 2020 2021 2022 2023 2018 2019 2020 2021 2022 2023 2018 2019 2020 2021 2022 2023
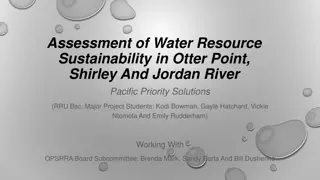
5 Sustainability Sustainability Report Data Trends (Otter River Mill) Greenhouse Gas from Fossil Fuel (Tons of CO2e) Water (Million Gallons) Production of Paper by Seaman (Short Tons) 320 2500 25000 310 24500 300 2000 24000 290 1500 23500 280 23000 270 1000 22500 260 500 22000 250 0 240 21500 2018 2019 2020 2021 2022 2023 2018 2019 2020 2021 2022 2023 2018 2019 2020 2021 2022 2023
6 Sustainability Sustainability Report Data Trends (Otter River Mill) Purchased Electricity (KWH/Ton) Water (1000 Gallons/Ton) Fossil Fuel GHG 0.1 980 13.5 0.09 0.08 960 13 0.07 940 12.5 0.06 920 12 0.05 0.04 900 11.5 0.03 880 11 0.02 860 10.5 0.01 840 10 0 2018 2019 2020 2021 2022 2023 2018 2019 2020 2021 2022 2023 2018 2019 2020 2021 2022 2023
7 Sustainability Sustainability Report Data Trends (Otter River Mill) Virgin Pulp Pre-Consumer Recycled Post-Consumer Recycled 60% 60% 3% 50% 50% 2% 40% 40% 2% 30% 30% 1% 20% 20% 1% 10% 10% 0% 0% 0% 2018 2019 2020 2021 2022 2023 2018 2019 2020 2021 2022 2023 2018 2019 2020 2021 2022 2023
8 Sustainability Sustainability Report Data Trends (Otter River Mill) Fiber Source 100% 90% 80% 70% 60% 50% 40% 30% 20% 10% 0% 2018 2019 2020 2021 2022 2023 Virgin Pulp Pre-Consumer Recycled Post-Consumer Recycled
9 Sustainability Sustainability Report Data Trends (Glatz Mill) Purchased Electricity (1000 KWHs) Natural Gas (1000 kWhs) 35000 200000 180000 30000 160000 25000 140000 120000 20000 100000 15000 80000 60000 10000 40000 5000 20000 0 0 2018 2019 2020 2021 2022 2023 2024 2018 2019 2020 2021 2022 2023 2024
10 Sustainability Sustainability Report Data Trends (Glatz Mill) Greenhouse Gas from Fossil Fuel (Metric Tons of CO2e) Water (1000 m3) Production of Paper (Metric Tons) 3000 45000 35000 2500 40000 30000 35000 2000 30000 25000 25000 1500 20000 20000 15000 1000 15000 10000 10000 500 5000 5000 0 0 0 2018 2019 2020 2021 2022 2023 2024 2018 2019 2020 2021 2022 2023 2024 2018 2019 2020 2021 2022 2023 2024
11 Sustainability Sustainability Report Data Trends (Glatz Mill) Fossil Fuel GHG (Metric Ton/Metric Ton) Purchased Electricity (kWh/Metric Ton) Water (m3/Metric Ton) 70 1.000 900 0.900 60 800 0.800 700 50 0.700 600 40 0.600 500 0.500 30 400 0.400 300 20 0.300 200 0.200 10 100 0.100 0 0 2018 2019 2020 2021 2022 2023 2024 2018 2019 2020 2021 2022 2023 2024 0.000 2018 2019 2020 2021 2022 2023 2024