Sustainability Plan Summary Objectives and Background
This document outlines the Sustainability Plan for December 10, 2012, focusing on the objectives, background, guiding principles, expenditures, and revenue challenges for a sustainable future. Key points include achieving financial balance, deriving revenue from diverse sources, and ensuring long-term success.

Uploaded on Feb 23, 2025 | 0 Views
Download Presentation

Please find below an Image/Link to download the presentation.
The content on the website is provided AS IS for your information and personal use only. It may not be sold, licensed, or shared on other websites without obtaining consent from the author.If you encounter any issues during the download, it is possible that the publisher has removed the file from their server.
You are allowed to download the files provided on this website for personal or commercial use, subject to the condition that they are used lawfully. All files are the property of their respective owners.
The content on the website is provided AS IS for your information and personal use only. It may not be sold, licensed, or shared on other websites without obtaining consent from the author.
E N D
Presentation Transcript
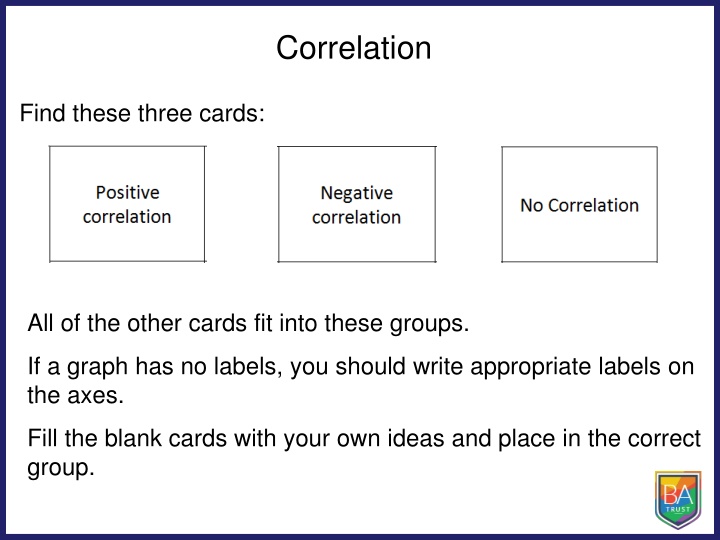
Correlation Find these three cards: All of the other cards fit into these groups. If a graph has no labels, you should write appropriate labels on the axes. Fill the blank cards with your own ideas and place in the correct group.
Writing sentences This graph shows positive correlation. Write a sentence on your whiteboard to describe what the graph is showing.
Writing sentences What type of correlation does this graph show? Write a sentence on your whiteboard to describe what the graph is showing.
Writing sentences Write a sentence to explain what this scatter graph is showing.
In your books Title: Correlation For each of the graphs below, write down the type of correlation and a sentence to explain what the graph shows.
Worksheet For each of the sentences on the worksheet: Discuss what the graphs would look like with your partner. Copy the sentence. Draw the appropriate, labelled graph from above. Write down the type of correlation Write down a sentence.
Correlation Correlation a link or relationship between two things that happen.
Is this a sensible correlation? Size of fire The more firemen fighting a fire, the bigger the fire is going to be. Therefore, firemen cause fire. Number of firefighters at fire No! It s the other way around. Fire causes firemen.
Is this a sensible correlation? Deaths by drowning As ice cream sales increase, death by drowning increases sharply. Therefore, ice cream causes drowning. Ice cream sales No! They are both things that happen more in summer.
Is this a sensible correlation? As the number of pirates has decreased, global warming has increased. Number of pirates Therefore, global warming is caused by a lack of pirates. Earth s temperature No! We don t need more pirates. These are completely unrelated and are a coincidence.
Is this a sensible correlation? During summer, people get hayfever. There is also lots of pollen in the air. People suffering from hay fever Therefore, pollen causes hayfever. Amount of pollen Yes, it makes sense and there have been studies to prove it.
Correlation and causation Just because a graph seems to show correlation, it doesn t mean it s true. It doesn t mean one thing causes the other. Sometimes another factor is involved. Sometimes it s the other way around. Sometimes it s a coincidence. Check that your conclusion makes sense.