Sustainable Development Strategy Report: Carbon Footprint Analysis & Environmental Impact Assessment
"Explore the carbon footprint analysis, computing impact, and travel emissions within the Sustainable Development Strategy report, focusing on existing detectors and key findings. Detailed comparisons and estimates provide insight into power consumption and environmental considerations for a more sustainable future."
Uploaded on | 0 Views
Download Presentation

Please find below an Image/Link to download the presentation.
The content on the website is provided AS IS for your information and personal use only. It may not be sold, licensed, or shared on other websites without obtaining consent from the author. If you encounter any issues during the download, it is possible that the publisher has removed the file from their server.
You are allowed to download the files provided on this website for personal or commercial use, subject to the condition that they are used lawfully. All files are the property of their respective owners.
The content on the website is provided AS IS for your information and personal use only. It may not be sold, licensed, or shared on other websites without obtaining consent from the author.
E N D
Presentation Transcript
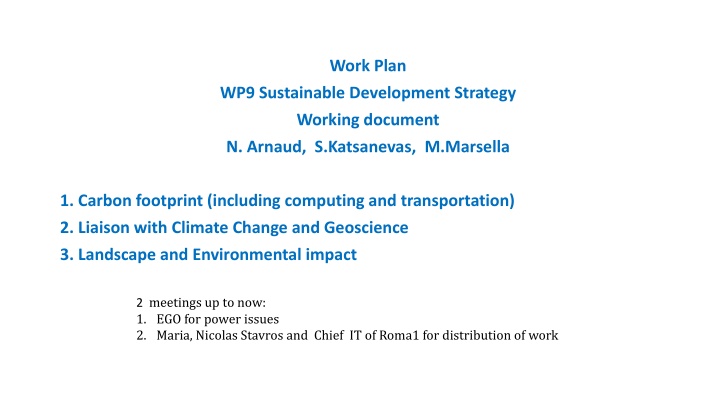
Work Plan WP9 Sustainable Development Strategy Working document N. Arnaud, S.Katsanevas, M.Marsella 1. Carbon footprint (including computing and transportation) 2. Liaison with Climate Change and Geoscience 3. Landscape and Environmental impact 2 meetings up to now: 1. EGO for power issues 2. Maria, Nicolas Stavros and Chief IT of Roma1 for distribution of work
WP9.1 Carbon footprint (including computing and transportation) We start our study with a comparison with the existing footprint of the current 2nd Generation detectors., based on a study done 2 years ago. SWP9.1.1 Power. Total power usage: LLO reports that they use on average 800 kW. This leads to a rough yearly number of kWh of 800*24*365 of 5,088,000 kWh -- 5GWh. For LHO: we average 700,000kWh per month. A good estimate for the year is 8,4 GWh. A very nice fact: the power for LHO is mostly renewables. Virgo:average power consumption of the EGO site is 320 kW annual energy consumption of the EGO site is between 2.4 to 3.2 GWh/year. In 2019 it has been 2.7 GWh. KAGRA: Power (kWh) consumption at KAGRA site.2,2 MWh. LHO is >50% higher power usage than LLO. Surprising? Weather Summary power usage: LHO: 8.4 GWh (100% renewables!), LLO: 5 GWh, Virgo: 2.7 GWh, KAGRA: 2.2 GWh Total is 18.3 GWh. subtracting LHO (green!), end up with 10 GWh. Using 1 kg CO2/kWH, get total power carbon footprint: 1e7 kg of CO2. ~1000 tons of CO2
WP9.1 Carbon footprint (including computing and transportation) WP9.1.2 Computing. LIGO: O3 computing cycles, 500 million CPU core hours, over roughly 18 24 months Baseline computing estimate: 250 million CPU core hours per year. Power/computing comes from ~10 different sources. Caltech. Milwaukee. XSEDE. etc. Assume average carbon footprint for US power. Virgo (not known yet). Kagra: The total computing cycles of KAGRA s dedicated clusters, assuming a duty cycle of 80% for each system. The total number is approximately 550k computing cycles/day ( 16M computing cycles/month). Combined computing is ~700M CPU core hours per year Supposing that 10 CPU core hours requires 0.52 kWh. So 700M CPU core hours requires 364 MWh each year. Using 1 kg CO2/kWH, get total power carbon footprint ~400 tons of CO2
WP9.1 Carbon footprint (including computing and transportation) WP9.1.3 Travel: Start with 2 main meetings? Start with LVK specific ones. ask LVK labs business office to give data on trips. At some point need to do poll. Also contact previous two LVK meetings. 3 Virgo weeks per year. Start google doc/sheet to collect information. Some scientific meetings are almost completely our community. Start with actual LVK collaboration activities (because we can influence). Exemples: Sonoma meeting: Asia (Japan, australia): 300, US: 200 Europe: 112, S. America (mostly Brazil): 12. .Using this calculator, it s 1.3 tons of CO2 from CDG to SFO. Sonoma meeting generated roughly: 200 tons of CO2. Glasgow meeting: Using the participant country breakdown for the Glasgow LVC meeting in 2016: one calculates ~120 tons CO2 Kagra:They have lists of participants of KAGRA members to LVK related conferences and in principle could estimate the total number of km traveled, maybe separating planes and other means of transport. But we better have a common way of doing this. How do we want to estimate the impact of travel? 24th KAGRA face-to-face meeting (University of Tokyo., December 2019) Participants: 110 ~ 54 tons CO2, 5th The KAGRA International Workshop (KIW), Perugia - Italy, 2019 ~123 tons CO2; Two annual international LVK conferences, plus assorted workshops: ~400 tons CO2
WP9.1 Carbon footprint (including computing and transportation) Bottom Line Power at sites: Travel: Computing: 1000 tons CO2 per year, 400 tons CO2 per year 400 tons CO2 per year The group will study the use of photovoltaic and geothermal energy. The study will be done within the LVK collaboration Collaboration with ET responsibles will permit the projection Ideas to be studied Photovoltaic, geothermal Reuse dissipated energy from computing center: Le supercalculateur Jean-Zay du CNRS va alimenter le r seau de chaleur et de froid du campus urbain de Paris-Saclay. Green Cube at GSI, 4% de l'energie pour le refroidissement. Virtual Data at IJCLab (-> Michel Jouvin) Reuse dissipated energy from vacuum and cryogenic installations ? Efficient internet / wifi distribution? Organize passive house buildings, green car shuttle, Videoconferences instead of travels? how much we gain , find the numbers Reduce travels Use trains/ships instead of planes/cars when possible Methodology:: workshops, and extra measuring devices for specific consumptions. Deliverable 1 / CO2 Impact from Power, Computing and travel.
WP9.2 Liaison with Geosciene, Atmospheric science and Climate change Earth and Astroparticle sciences share a mutual scientific culture based on common objects of study, methods and approaches. First, the Geosphere, a direct object of study of Geoscientists, is both the target and the detecting medium for Astroparticle observatories. Second, Astroparticle Physicists and Geoscientists both deal with complex natural large scale systems, deploy large sensor networks, sometimes in extreme environments (sea, desert, underground, space), use long series of precise observations acquired over long time scales, emit low latency alerts develop models relying on the state-of- the-art in fundamental physics, chemistry, biology and computer sciences. They both can serve for measuring climate change and produce low latency alerts. The EInstein Telescope is a perfect example of the above: Imaging (gravimetric, seismic, acoustic, muon, neutrino); Data collection in extreme environments; New technological means for parametermonitoring; Contribution to the understanding and forecasting and natural alerts of natural hazards. Eg. ET will deploy a sophisticated distributed network of sensors to evaluate and subtract environmental background: electromagnetic perturbations, non-stationary ground deformations, sea waves, cloud passage, electromagnetic waves, cosmic rays, acoustic noise vibrations, anthropogenic movements; Exemples: Fiber or mobile sensor networks, distribution of Low Latency alerts, Methodology: worldwide workshops Deliverable: Studies of the use of the ET technology on measurements of the climate change, low latency alert and also quantum computing
WP9.3 Landscape and Environmental impact Site mostly underground Surface buildings + access roads + site roads Power grid infrastructure Excavations: access pipes and tunnels: what to do with the excavated material? Local food Green transportation (on-site and to/from site): antonella, lot de calcul par ed porter et Katsavounides/Couvares Find the studies GWIC... 100% electrical vehicles on site Charging stations Transportation to/from campus: regular schedule
Whom to contact: ET ISB/VAcuum/cryo, EIB/computing, ISB/Fuentes+Maria LVK meeting to reevaluate some of th enumbers SKA, CTA , KM3NEt , LSST, LHC FCC: FCC Feasibility Study (FS) 2021 -> 2025 https://indico.cern.ch/event/1055562/contributions/4460980/attachments/2286764/3886757/ECFA-FCC- 2021.pdf Platform for the the project follow-up (Roma1) Resources asked : 2FTEx3 years 330 KE (55 KE/year) (technical side, institutional side) Funds for workshops 50 KE Fund for travel 20 KE

