Sustainable Livelihoods Approach and Capitals Analysis at Household Level in Coastal Sandy Zone
Sustainable Livelihoods Framework Analysis is applied to evaluate household capitals and assets in Thua Thien Hue, Vietnam. The case study focuses on issues such as land degradation, climate change impact, and poverty reduction pathways.

Download Presentation

Please find below an Image/Link to download the presentation.
The content on the website is provided AS IS for your information and personal use only. It may not be sold, licensed, or shared on other websites without obtaining consent from the author.If you encounter any issues during the download, it is possible that the publisher has removed the file from their server.
You are allowed to download the files provided on this website for personal or commercial use, subject to the condition that they are used lawfully. All files are the property of their respective owners.
The content on the website is provided AS IS for your information and personal use only. It may not be sold, licensed, or shared on other websites without obtaining consent from the author.
E N D
Presentation Transcript
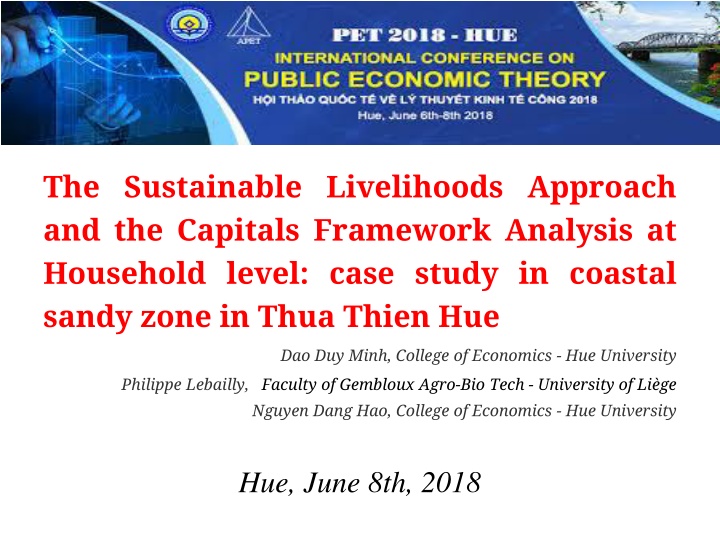
The Sustainable Livelihoods Approach and the Capitals Framework Analysis at Household level: case study in coastal sandy zone in Thua Thien Hue Dao Duy Minh, College of Economics - Hue University Philippe Lebailly, Faculty of Gembloux Agro-Bio Tech - University of Li ge Nguyen Dang Hao, College of Economics - Hue University Hue, June 8th, 2018
1. Introduction Sustainable Livelihoods Framework Analysis proposed by Robert Chambers at the midterm of 1980. After that this ideal has been continuously applied by various practitioners such as Ellis, 1998; Chambers and Conway, 1992; Carney, 1998; Barrett, 2006; DIFD (2001). Until now, relating to rural development and household, this framework has been widely applying in empirical research of many countries on the world. This framework has been rarely applying to evaluate related issues of capitals/ assets during a period. Related research site of application, Thua Thien Hue are currently standing at the difficult province in economic development of Vietnam; Over 70 % of households have been living in rural areas and mainly income sourced from agricultural activities including cultivating wet rice, raising small scale poultry and aquaculture (Tinh et al 2012, Hao. N.D 2009).
1. Introduction (Cont.) In addition, Thua Thien Hue has been also facing with various problems of land issues: low land area per capital, low levels of soil fertility, land degradation which leads the low productivity in using land. Thua Thien Hue also have been impacted heavily by climate change, especially in agricultural activities of households with unpredictable trends; Labour source was still low level of skill gathering with lack of job which leads the difficulty in finding appropriate works; Further more, although local government has been implementing various implications to improve livelihood for household, but households are still facing with some current drawbacks such as lacking of information, poorly infrastructure condition, low ability in accessing credit and market. Given aspects will also effect on the poverty reduction pathways for the households. Using Sustainable Livelihood Framework Analysis to carry out the change of 5 capital after 10 years from 2007_08 to 2017_18 will be significantly in proposing implications of the livelihood strategy as well as the foundation to build the adaptive capacity in adapting to climate change.
CONTENTS 1. Introduction 2. Research objectives 3. Framework analysis and research methods 4. Results and discussions 5. Conclusions
2. Research objectives (i) To carry out the dynamic changes in the capital of household during 10 year period; (ii) To analyze the change in livelihood strategy/ farming system of household; (iii) The results from study will be the bases for proposing sustainable strategy for household as well as building the adaptive capacity of household to adapt to climate change.
3. Framework analysis and research method 3.1. Framework analysis Livelihood outcomes Livelihood assets Transforming structure and processes Vulnerable context Structures - More income - Level of In order to achieve -Increase well being government Human - Trends Livelihood -Reduce vulnerability Natural - Private sector Social strategies - Seasonality -Improve food security - Laws - Shocks Financial Physical -Improve social equity Policies - More sustainable use NR base Culture Processes - Saved non use value of NR Institution Figure 1: Sustainable Livelihoods Framework Analysis Source: DFID (2000)
3.2. Methods 3.2.1. Data collection - Secondary data: - Primary data: 1. Historical profile: 2. Key informant interview: 3. In depth interview: 4. Focus Group Discussion: 5. Household survey:
Table 1. The distribution of households by research sites Village 2007_08 2017_18 HHs % HHs % Duc Phu 20 14.5 17 15.5 Dong Cao 20 14.5 16 14.5 Thuy Lap 18 13.0 16 14.5 Nghia Lap 18 13.0 17 15.5 Xuan Thien Thuong 20 14.5 14 12.7 Vinh Luu 20 14.5 14 12.7 Phung Chanh 22 15.9 16 14.5 Total 136 100 110 100
Table 2 The related indicators of the study No Dimension Indicator 1 Land Structure of each type of land use; Total land area/ household 2 Labour The allocation of labour by sector; the unemployment ratio of labour; Educational level; high skill level labour; the number of trained labour; Average labour/ household; total immigration labour; % of household lacking of labor 3 Physical Infrastructure condition; road connection ability; the distance of house to the central of commune; Material investment: average of TV, car, motor / household 4 Financial Total owed saving, ratio of credit access 5 Social The participation of mass organization in the local, the relation of household with community.
3.2.2. Data processing: After finishing of collect data by questionnaire, it will be cleaned and coded for the process of inputting data to the designed template by SPSS software. Author will use some basic tool such as frequency and descriptive to recheck outlier and missing value. 3.2.3. Data analysis - Descriptive method - Before and after method: compare the changes of those indicators (among periods (2007_08; 2017_18)
The change in labor resources Table 2. The head of household by age groups in the 2007-08 2017-18 period Comparis on No of HHs Age groups 2007_2008 of % HH 2017_2018 of % HH No HHs Mean No HHs Mean <50 45 40.9 44.1 7 6.4 47.9 -38 50-60 48 43.6 53.9 46 41.8 56.1 -2 >60 17 15.5 66.9 57 51.8 68.3 40 Average/total 110 100 51.9 110 100.0 61.9 0
The change in labor resources Table 3. The size of households in the 2007_08 2017_18 period 2007_2008 2017_2018 Compariso n Group No of HHs % HH Mea n No HHs of % HH Mean No of HHs 9 8.2 2.4 36 32.7 2.7 27 <3 38 34.5 4.8 46 41.8 4.5 8 4-5 45 40.9 6.4 22 20.0 6.2 -23 6-7 18 16.4 9.2 6 5.5 8.2 -12 >7 Average/tot al 110 100 5.9 110 100 4.4 0
The change in labor resources Table 4. The change of household member No of HHs % Increase of household member 12 11 Decrease of household member 69 63 Total Table 5. The changes of household members by destination 110 - Total of increasing member Average of increasing member Total of decreasing member 21 0.2 169 Average of decreasing member 1.5 Total member of moving inside province Average member of moving inside province 42 0.4 Total member moving outside province Average member of moving outside province 127 1.2
The change in labor resources Total % member of moving inside province 25% Total member moving outsite province 75% Figure 1 . Destinations of movoved members
The change in labor resources Table 6. Distribution of households by age classes and gender, (% of surveyed households members) Age groups 2007_08 2017-18 Male Female Total Male Female Total (Year) <12 6 8 15 2 3 3 12-18 10 9 19 6 29 17 18-55 30 25 55 36 63 50 >55 5 6 12 56 5 30 Total 52 48 100 49 51 100
The change in labor resources Table 9. Structure of occupation of households (% of occupation) Types 2007_08 2017_18 2017_18/2007_08 Farm 49 43 -6 Other 51 57 6 works
The change in land use status Table 11. Land use average by scale between 2007_08 and 2017_18 2007_2008 Land scale 2017_2018 Comparison No of HHs % HHs Mean No of HHs % HHs Mean No HHs of % HHs Mean (sao) 52 47.3 11.8 39 35.5 10.7 -13 -11.8 -1.0 <15 (sao)* 14 12.7 17.5 22 20.0 18.5 8 7.3 -3.0 15-20 (sao) 44 40.0 32.7 49 44.5 40.3 5 4.5 -10.0 >20 (sao) 110 100 22.2 110 100 23.5 0 0 0 Average/total
The change in land use status 27 30 Stable Decrease Increase 20 20 43 18 16 14 12 10 6 6 8 Yes (% households) 6 3 Figure 3. Reasons of increasing land use scale 4 1 2 - Figure 2. Land use changes of households among 2007_08-2017_18 period (% households)
The change in land use status Table 12. Gini index comparison between 2007_08 and 2017_18 2007_08 2017_18 Comparison 0.31 Gini 0.45 -0.15 1 0.9 0.8 0.7 0.6 Equality 0.5 Lorenz Curve 2007_08 0.4 Lorenz Curve 2017_18 0.3 0.2 0.1 0 0 0.2 0.4 0.6 0.8 1 Figure 5. Land equality comparison between 2007_08 and 2017_18
The change in land use status Table 13. The changes in land use strategy Type of changes Transforming/ expanding perennial trees Transforming / changing crop season Changing in raising aquaculture model (mono model into % Hhs 9 27 10 mixed model) Stop raising aquaculture 3 50 36 Changing in raising cattle scale Changing in raising poultry
Physical capital By the improvement in living condition, households spent amount of money for buying more modern housing various types of valuable accesses; At present, many households invested new updated modern machine that could help to reduce the time and save the cost in producing activities. It was also replicated in infrastructure, the connecting road among each village, commune, district and also for city 100% of household could approach with safe water and electricity. For sanitization issues, with the deeply consideration of different level of governments, various dams were built that solved the negative effect of this problem.
Table 14. Changes in accessibility to the basic infrastructure in the seven communes of the survey, over 2007_08-2017_18 period 2007_08 2017_18 M DT MM E SW S MR DT MM E SW S R Duc Phu ++ ++ +++ + + ++ ++ ++ +++ ++ ++ + + - Dong Cao 0 - + + - ++ ++ ++ ++ ++ ++ Thuy Lap ++ ++ ++ + + ++ ++ ++ ++ ++ ++ + + + Nghia Lap + + + + 0 ++ ++ ++ +++ +++ + Xuan Thien + 0 + + + - ++ ++ ++ +++ +++ + Thuong Vinh Luu + ++ + + + - +++ +++ ++ +++ +++ ++ Phung Chanh + + + + + - ++ ++ ++ +++ ++ + Total ++ ++ ++ +++ ++ ++ Note: MR: main road; DT: district town; MM: main market; E: electricity; SW: safe water; S: sanitization
5. Financial capital Table 15. Rate of households accessing credit over 2007_08-2017_18 period (% of surveyed households) 2007-_08 2017_18 2017_18/2007_08 Size of credit (million VND/hh) -By nominal rate -By real rate Percentage of household with loans (%) 1 to 10 million VND (%) 10 to 20 million VND (%) > 20 million VND (%) 10.8 10.8 61 46 33 21 21.8 12.2 42 13 26 61 11.0 1.4 -19 -33 -7 40
5. Financial capital Credit providers In study sites, The Vietnam Bank for Agriculture and Rural Development (VBARD) and the Vietnam Bank for Social Policy (VBSP) play crucial roles in providing credit for citizens, around 80% of household lending money from this two banks, the reason came from lower rate and did not need the witnessing access and also the target groups aimed at poor households. The rate of this credit fluctuated from 6-7%/ year and around 8%/ year for VBSP and VBARD respectively.
Social capital 97 99 100 90 80 70 60 45 50 36 36 32 40 30 19 18 18 18 18 20 5 10 0 Figure 6. Rate of households participation in social networks, 2007_08-2017_18 period (% of surveyed households)
Conclusions Labor evolution: After 10 year period, it witnessed the reduction on in the household size, nearly 1.3 member of reduction per household . Although half of the surveyed households have education beyond primary school, 3 % of them are illiterate, over 60 % of the work force do not have any professional training, but in recently, educational level has been upgrading compared with 2007_08 period, over 20% of population studying with upper level. Land use changes: The farm size is relatively small and considerably varies between the different household categories and study sites. After 10 years, the total land use increased 0.2 sao/ household, the main reason come from the allocation policy, local government promoting household exploiting none use and waste land for developing perianal trees as well as crop season. Although in the whole of period, land fragmentation reduced significantly, but it still exited barriers for household in using efficiency ways. Almost land used were evaluated at the bad quality, in some study sites, land use improved quality by using appropriate of cultivation method. Physical capital: with the improvement in living condition, households spent amount of money for buying more modern housing various types of valuable accesses such as motorbike, smart phone. At present, many households invested new updated modern machine that could help to reduce the time and save the cost in producing activities. It was also replicated in infrastructure, the connecting road among each village, commune, district and also for city 100% of household could approach with safe water and electricity. For sanitization issues, with the deeply consideration of different level of governments, various dams were built that solved the negative effect of this problem.
Conclusions Financial capital: Although the size of credit increased from 2007_08 to 2017_18, 10.8 million/ household compared with 21.8 million/household in 2017_18. But the percentage of households accessing credits has significantly decreased. In 2007_08 more than half of the surveyed households had accessed to credit compared with around 40% in 2017_18. VBARD and the Vietnam Bank for Social Policy VBSP play crucial roles in providing credit for citizens, around 80% of household lending money from this two banks. Social capital: WU and FA are the most popular social networks that have attracted most of the farmers in the study sites; 95 % of the surveyed households reported their membership to WU and FA at local level. By participating to WU and WF, various types of benefit could be taken into account. Local people willingness to are participate in social and cultural activities for saving and developing traditional and cultural values. Hence, women are now active more in producing process, marketing orientation as well as get easier in approaching education, healthcare service, information, technology, credit and land.


")