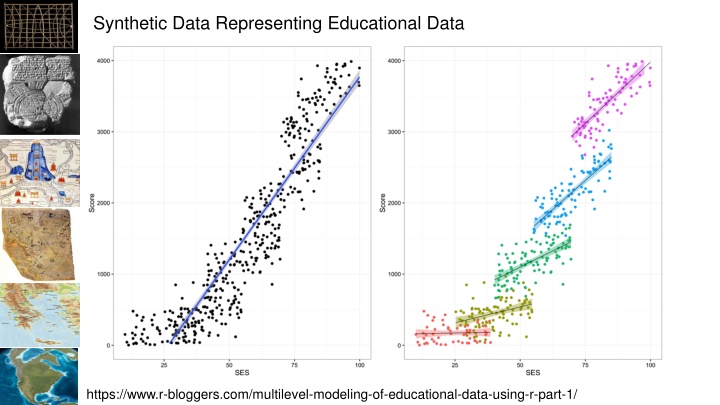
Synthetic Data Representing Educational Data
In this synthetic educational data representation, we delve into the intricacies of multi-level modeling to examine changes over time, behaviors of multiple species, and student performance across different educational levels. The example illustrates predicting test scores based on various factors within classes, schools, and districts. The content outlines the concept of mixed models and presents equations for multi-level analysis to understand data at different hierarchical levels.

Download Presentation

Please find below an Image/Link to download the presentation.
The content on the website is provided AS IS for your information and personal use only. It may not be sold, licensed, or shared on other websites without obtaining consent from the author.If you encounter any issues during the download, it is possible that the publisher has removed the file from their server.
You are allowed to download the files provided on this website for personal or commercial use, subject to the condition that they are used lawfully. All files are the property of their respective owners.
The content on the website is provided AS IS for your information and personal use only. It may not be sold, licensed, or shared on other websites without obtaining consent from the author.
E N D
Presentation Transcript
Synthetic Data Representing Educational Data namNm15 https://www.r-bloggers.com/multilevel-modeling-of-educational-data-using-r-part-1/
namNm15 http://4.bp.blogspot.com
Problem What if we want to model: Changes in a group over time Group by time slices (month, year) Behavior of multiple species in same area Group by species Look at student performance between classes, schools, districts? Multiple spatial scales namNm15
Example Create a linear regression model that predicts test scores based on income in an area Within a class, scores might vary based on student s family income Within a school, scores might vary based on teachers Within a district, scores might vary based on property value around the school namNm15
Mixed Models a.k.a. Multi-Level Models Models have multiple levels (typically 2) The coefficients of one level of the model become the dependent variable of the second level of the model The first level groups data, the second level models coefficients between groups Also known as: Mixed Effects Models Hierarchical Models (more general term) Random Effects Models namNm15
Multi-Level Models Level 1: ???= ?0?+ ?1?(???) + ??? Level 2: ?0?= ?00+ ?01??+ ?0? ?1?= ?10+ ?1? namNm15
Level 1 Define a traditional linear regression as: ???= ?0?+ ?1?(???) + ??? Where: i is the individual observation j is the group ??? = level 2 response values ??? = level 2 predictor values ?0? = intercept for group j ?1? = slope for group j ??? = random error for individual observation in group j namNm15
Level 2 Define linear regression equations for the coefficients in level 1: ?0?= ?00+ ?01??+ ?0? ?1?= ?10+ ?1? Where: ?00 = mean of all intercepts ?01 = overall slope at level 2 ?? = level 2 predictor ?0? = random error of intercept for a group ?10 = overall slope at level 2 ?1? = random error of slope for a group namNm15
Level 1 Slopes and/or intercepts in all groups: Have the same value Are non-randomly varying Can be predicted at level 2 Are randomly varying Each has their own slope and intercept namNm15
Example Modeling age of herbivores Sample includes wildebeest and zebras Predictor could be forage quality Overall average is based on both populations namNm15
Mixed Models Contains Fixed and Random effects Fixed: Only random effect is sampling error Random: Explanatory variables from random distribution Effect is not directly correlated to response Also known as: Mixed Effects Models namNm15
Assumptions Same assumptions hold (linearity, homoscedasticity, residuals normally distributed) within each group The observations are grouped: Homoscedasticity can vary between groups Independence Groups can be more alike than between groups namNm15
Types Linear Mixed Models (LMM) Generalized Linear Mixed Models (GLMM) Generalized Additive Mixed Model (GAMM) Treats smoothing functions as coefficients in a level 2 model Example: McIntosh, R. et. al., 2015, Drivers and annual estimates of marine wildlife entanglement rates: A long-term case study with Australian fur seals namNm15
In R Linear: lme() package stats Generalized Linear: lmer() - package lme4 gamm() package mgvc Performs poorly with binary data, not as stable as gam() gamm4() package and function More stable than gamm() See other issues namNm15