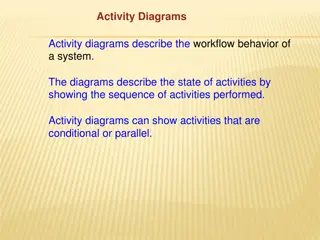
System Diagrams

A systematic simplification of reality to promote understanding, system models are essential in engineering to analyze complex problems. They can be in the form of pictures, flowcharts, formulas, and can describe different views of a system.

Download Presentation

Please find below an Image/Link to download the presentation.
The content on the website is provided AS IS for your information and personal use only. It may not be sold, licensed, or shared on other websites without obtaining consent from the author.If you encounter any issues during the download, it is possible that the publisher has removed the file from their server.
You are allowed to download the files provided on this website for personal or commercial use, subject to the condition that they are used lawfully. All files are the property of their respective owners.
The content on the website is provided AS IS for your information and personal use only. It may not be sold, licensed, or shared on other websites without obtaining consent from the author.
E N D
Presentation Transcript
System Diagrams A VISUAL REPRESENTATION OF THE SYSTEM
Model A model is a description from which detail has been removed in a systematic manner and for a particular purpose A simplification of reality intended to promote understanding Models are the most important engineering tool, they allow us to understand and analyze large and complex problems A model can be: A picture A visual flow (sequence, flowchart, relationship) A formula that approximates a metric related to an attribute of the system (performance, complexity, usability, ) A model can describe different views of the system https://www.cl.cam.ac.uk/teaching/1112/SWDesign/softwaredesign01.pdf
Views and Models User Model How a user interacts with the software Flowcharts; process maps; Interface view How different APIs are used Sequence diagrams; System View How components interact with each other Main components; connections; operations; Performance Model How you can calculate the performance of an operation or operations within certain scenarios Spreadsheets; formulas;
Types of Views System Diagram Abstract description of the system whose requirements are being modeled Module View Define the structure of the code base Component and Connector Views Specify the structure and behavior of runtime elements in the system Allocation Views The mapping of software units to elements of an environment Quality Views A view created by extracting relevant pieces of structural views and packaging them together Behavior Views Describe interactions between components while the system is a specific state
Which Views? The Ones You Need! Different views support different goals and uses The views you document depend on the stakeholders and uses of the documentation. Each view has acost and a benefit; the benefits of maintaining a view should outweigh its costs At a minimum, at least on module view and one component and connector view
System Diagram Abstract Description of the system whose requirements are being modeled Components of a System Diagram: Boundaries of the overall system Inputs to and outputs from the system Subsystems of the system Identification of the interfaces between the subsystems A System Diagram is a high-level model of the system. It also describes decisions make on the overall high level design
Why Create a System Diagram? To help explain the proposed requirements to other system stakeholders. To discuss design proposals with engineers and to document the system for implementation. To show the organization and architecture of the system.
Type of System Diagrams Choose the type of information you want to convey AND what questions you are trying to answer Big blocks APIs Physical assets Data or communications System Diagrams are variable in their view of the system A system diagram can show - Components - Interactions - Boundaries - Then select HOW you will show it Components & Interactions tend to be the most common
Toaster System Diagram: Inputs Outputs System Where s the WIFI connection? https://deseng.ryerson.ca/dokuwiki/_detail/design:toasterarchitecture.jpg?id=design%3Asystem_diagram
Allocation View UML Deployment Diagram Example
Usage of Allocation Views Specify structure and behavior of runtime elements such as processes, objects, servers, data stores Reasoning and decisions about What hardware and software is needed Distributed development and allocation of work to teams. Builds, integration testing, version control System installation Deployment Elements Software element Some runtime packaging of logical modules and components (e.g., processes) Environmental element - execution (hardware, runtime operation) or development (file structure, deployment, development organization) Properties that are provided to the software; e.g., bandwidth Relations Allocated to - a software element is mapped (allocated to) an environmental element Static or dynamic (e.g., resource allocation)
Metrics & Performance: Allocation to the system Database usage: Average query: 2Kbytes Queries/ Day: 20,000 Transactional load: Queries/ Day x Query size Retail Size of item: 1k # of items: 5000 Size of DB Storage: 5000 x 1,000 = 5MB Performance: Image recognition system 10 seconds per operation 10,000 request per minute 100,000 seconds CPU time required per minute** ** Will that work?