System Safety and Reliability Analysis Overview
This content delves into the root causes of failure in systems, highlighting the importance of identifying defects early in the life cycle to ensure reliability. Various causes of failures in industries such as procurement, plant engineering, management, sales, production, and maintenance are explored through practical examples and images.

Download Presentation

Please find below an Image/Link to download the presentation.
The content on the website is provided AS IS for your information and personal use only. It may not be sold, licensed, or shared on other websites without obtaining consent from the author.If you encounter any issues during the download, it is possible that the publisher has removed the file from their server.
You are allowed to download the files provided on this website for personal or commercial use, subject to the condition that they are used lawfully. All files are the property of their respective owners.
The content on the website is provided AS IS for your information and personal use only. It may not be sold, licensed, or shared on other websites without obtaining consent from the author.
E N D
Presentation Transcript
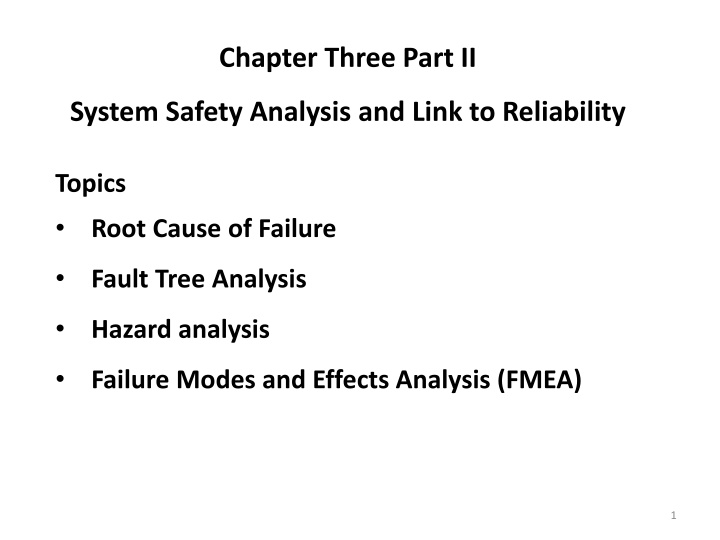
Chapter Three Part II System Safety Analysis and Link to Reliability Topics Root Cause of Failure Fault Tree Analysis Hazard analysis Failure Modes and Effects Analysis (FMEA) 1
Root Cause of Failure For a reliability problem, when an analysis of the true root cause of failure is done, the source of the defects that created the failure will be known. An analysis of root causes of reliability problems in various industries yields the following causes: Procurement: 12% of the failures were caused by wrong parts, late delivery, vendor selection and other factors Plant Engineering: 22% of failures were caused by improper design, modification or other changes 2
Management: 11% of the failures were caused by management philosophy that drove a reactive mindset (don t waste time doing a quality repair; get it running quickly!) Sales: 15% of the failures were caused by improper product mix (resulting in numerous process changes), delivery commitments, order size and other factors 3
Production: 23% of the failures were caused by improper planning, poor procedures and operator errors Maintenance: 17% of the failures were caused by improper maintenance, poor planning and errors Another way of illustrating this point is the Reliability Model, shown below, introduced by Ron Moore in his book, Making Common Sense Common Practice. 4
This model illustrates that defects can be produced at any point in the life cycle of a physical asset. 6
A potential defect is produced if: the engineer designing the system selects equipment that is minimally adequate, the purchasing agent selects a poor quality component because it s cheaper, the storeroom attendant does not store the component in a way that protects its physical integrity, the person installing the asset does not use precision methods for alignment or balancing 7
the operator starting up and running the equipment does not use the proper procedures, the craftsman performing routine maintenance does not do so with the appropriate degree of precision and care, All of these defects have the opportunity to result in throughput losses, quality losses or downtime. The end result is that we pay a penalty in manufacturing performance and spend labor and material resources unnecessarily. 8
Fault Tree Analysis Fault Tree Analysis (FTA) is one of the most important logic and probabilistic techniques used in system reliability assessment. A fault tree (FT) is a top-down logical diagram that displays the interrelationships between a critical system event and its causes. 9
The main elements of a fault tree are: TOP event, which is the description of the critical system event Basic events, they are the lowest level of identified causes Logic gates, such as OR or AND gates, which gives the logical relationship between the TOP event and the basic events Fault tree analysis is the qualitative and quantitative analyses that can be carried out on the basis of a fault tree. 10
FTA is a System Analysis Tool Evaluates complex systems (small to large) Identifies causal factors that can result in an Undesired Event Visual Model - displays complex cause-consequence combinations Combines failures, errors, normal events, time, HW, SW, HE Deductive (general to the specific) Provides risk assessment (Quantitative / Qualitative) Defined, structured and rigorous Easy to learn, perform and follow Utilizes Boolean Algebra, probability theory, reliability theory, logic Proven over time 11
Fault Tree Analysis Work from the overall system backwards towards the component level (top down or deductive approach) Identify system fault modes and possible causes Assign probabilities to each fault mode Build a tree and use it to evaluate overall reliability, availability, etc. 12
Why Do A FTA? Root Cause Analysis Identify all relevant events and conditions leading to Undesired Event Determine parallel and sequential event combinations Model diverse/complex event interrelationships involved 14
Risk Assessment Calculate the probability of an Undesired Event (level of risk) Identify safety critical components/functions/phases Measure effect of design changes 15
Design Safety Assessment Demonstrate compliance with requirements Shows where safety requirements are needed Identify and evaluate potential design defects/weak links Determine Common Mode failures 16
Fault tree analysis is often carried out in five steps: 1. Definition of the problem, system, and boundary conditions of the analysis 2. Construction of the fault tree 3. Identification of minimal cut sets 4. Qualitative analysis of the fault tree 5. Quantitative analysis of the fault tree 17
Minimal Cut Sets Identification of minimal cut sets is one of the most important qualitative analysis of a fault tree. A cut set in a fault tree is a set of basic events whose (simultaneous) occurrence ensures that the TOP event occurs. Minimal cut set is a cut set that cannot be reduced without losing its status as a cut set. The TOP event occurs if one or more of the minimal cut sets occur. 19
Consider a SIF that comprises three pressure transmiers (voted 2oo3), one logic solver, and two shutdown valves (voted 1oo2). The critical event is that the pressure becomes to high, due to a failure of the SIF. The corresponding fault tree can be as shown below 24
With larger and more complex fault trees we need to use special tools (implementing algorithms for extraction) of minimal cut sets. 25
Comparison with Reliability Block Diagram The system on the previous slide may also be represented by reliability block diagram, as seen below. With this simple structure, we identify easily the same minimal cut sets (denoted Ci ): 27
Fault Tree Symbols for koon Systems The fault tree structure below indicates that the subsystem of pressure transmiers are voted 2oo3. 28
Qualitative Analysis Qualitative analysis of the fault tree may include: Analysis of minimal cut sets, including: To identify and verify any single points of failure? To identify that other main contributors (e.g. for minimal cutsets up to order 3) seem correct I Common cause and dependency analysis: This may include to check if logical events connected by local AND- gates are independent Review minimal cut sets up to e.g order 3 to check if there are dependencies and if they must be modelled 29
Quantitative Analysis The TOP event occurs if one of the minimal cut sets occurs The main challenge is therefore to identify the minimal cut sets If all minimal cut sets were independent, we could calculate the the probability of the top event by: 30
Hazard Function Hazard is the potential to cause harm. Harm including ill health and injury, damage to property, plant, products or the environment, production losses or increased liabilities. 37
The hazard function is the ratio of the probability density function h(x) = ?(?) ?(?) ? ?(?) to the survival function, S(x). ?(?) = Hazard plots are most commonly used in reliability applications. The following is the plot of the normal distribution hazard function 38
Survival functions are most often used in reliability and related fields. The survival function is the probability that the variate takes a value greater than x. S(x) = p(X>x) = 1 F(x) The plot of the normal distribution survival function. For a survival function, the y value on the graph starts at 1 and monotonically decreases to zero. The survival function should be compared to the cumulative distribution function 39
Cumulative Hazard Function The cumulative hazard function is the integral of the hazard function. ? ? = H(x) = Which can be alternatively expressed as H(x) = -ln(1- F(x)) The plot of the normal cumulative hazard function 40
FMEA and FMECA Failure Modes and Effects Criticality Analysis Work from the component level and identify all possible fault modes at the component level (a team effort and bottom-up approach) Assess criticality of each component fault and its effects on overall system performance 41
Build a table with all fault modes, assign probabilities, severity, determine interactions, possible actions, etc. Three factors for failure analysis: The severity of a failure (Sev), The probability of occurrence of the failure (Occ), The likelihood of detecting the failure (Det) RPN (risk priority number)=(Sev)(Occ)(Det): quantify overall risk for a specific failure Use the table to asses overall reliability (see an example) 42
Performance Indexes reliability, operational availability, failure rate, and Expected time between failure (MTBF). 43


")