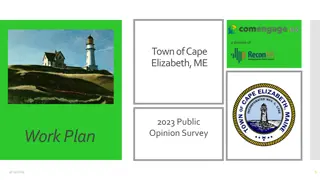
Tax Impact Analysis for Town of Cape Elizabeth
In this analysis, different options for construction and renovation projects in the Town of Cape Elizabeth, Maine, are evaluated based on debt structure, debt amounts, terms, rates, and tax impact. Various scenarios with varying bond durations and amounts are considered to assess the financial implications of each option. The report outlines the total interest, debt service, annual payments, and potential tax increases associated with each option.

Download Presentation

Please find below an Image/Link to download the presentation.
The content on the website is provided AS IS for your information and personal use only. It may not be sold, licensed, or shared on other websites without obtaining consent from the author.If you encounter any issues during the download, it is possible that the publisher has removed the file from their server.
You are allowed to download the files provided on this website for personal or commercial use, subject to the condition that they are used lawfully. All files are the property of their respective owners.
The content on the website is provided AS IS for your information and personal use only. It may not be sold, licensed, or shared on other websites without obtaining consent from the author.
E N D
Presentation Transcript
DRAFT TAX IMPACT ANALYSIS February 8, 2024 SBAC
DEBT PRO FORMA IMPACT Relying on our Financial Consultant to assist in debt structure and modeling Debt amounts, terms, rate, and annual payments analyzed A combination of 20 and 30 year bonds considered for all seven options Renovation improvements with 20 year bond, new construction on 30 year bond Combined impact of bond mix was reviewed Theoretical tax impact identified
Townof CapeElizabeth, Maine TaxImpact From: OptionA $0 Construction 30 Years To (w/HVAC): OptionA $0 Construction 30 Years $36,562,500 Renovations 20 Years $36,562,500 $36,562,500 Renovations 20 Years $36,562,500 Amount Consolidated Consolidated Term 3.25% 100.00% 3.50% 0.00% 3.25% 100.00 % 3.50% 0.00% Rate 100.00% 100.00% % of Option $13,732,059 $50,294,559 $2,514,728 $0 $0 $0 $13,732,059 $50,294,559 $2,514,728 6.24% $13,732,059 $50,294,559 $2,514,728 $0 $0 $0 $13,732,059 $50,294,559 $2,514,728 6.24% TotalInterest TotalDebt Service Annual Payment Tax Increase OptionB $16,671,541 Construction 30 Years OptionB $16,671,541 Construction 30 Years $47,891,363 Renovations 20 Years $64,562,904 $81,206,783 Renovations 20 Years $97,878,324 Amount Consolidated Consolidated Term 3.25% 74.18% 3.50% 25.82% 3.25% 100.00 % 3.50% 0.00% Rate 100.00% 100.00% % of Option $17,986,927 $65,878,290 $3,293,915 $10,522,077 $27,193,618 $906,454 $28,509,004 $93,071,908 $4,200,369 10.42% $30,499,455 $111,706,238 $5,585,312 $10,522,077 $27,193,618 $906,454 $41,021,532 $138,899,856 $6,491,766 16.10% TotalInterest TotalDebt Service Annual Payment Tax Increase OptionC $42,605,695 Construction 30 Years OptionC $42,605,695 Construction 30 Years $73,507,268 Renovations 20 Years $116,112,963 $100,658,301 Renovations 20 Years $143,263,996 Amount Consolidated Consolidated Term 3.25% 63.31% 3.50% 36.69% $26,890,157 $69,495,852 $2,316,528 3.25% 70.26% 3.50% 29.74% $26,890,157 $69,495,852 $2,316,529 Rate 100.00% $54,497,846 $170,610,809 $7,372,276 18.29% 100.00% $64,695,168 $207,959,164 $9,239,695 22.92% % of Option TotalInterest TotalDebt Service Annual Payment Tax Increase $27,607,689 $101,114,957 $5,055,748 $37,805,011 $138,463,312 $6,923,166 OptionD $83,502,665 Construction 30 Years OptionD $83,502,665 Construction 30 Years $55,398,521 Renovations 20 Years $138,901,186 $83,724,695 Renovations 20 Years $167,227,360 Amount Consolidated Consolidated Term 3.25% 39.88% 3.50% 60.12% $52,701,869 $136,204,534 $4,540,151 3.25% 50.07% 3.50% 49.93% $52,701,869 $136,204,534 $4,540,151 Rate 100.00% $73,508,317 $212,409,503 $8,350,400 20.71% 100.00% $84,146,996 $251,374,356 $10,298,642 25.55% % of Option TotalInterest TotalDebt Service Annual Payment Tax Increase $20,806,448 $76,204,969 $3,810,249 $31,445,127 $115,169,822 $5,758,491 OptionE.1 $76,977,386 Construction 30 Years OptionE.1 $76,977,386 Construction 30 Years $33,954,824 Renovations 20 Years $110,932,210 $63,826,795 Renovations 20 Years $140,804,181 Amount Consolidated Consolidated Term 3.25% 30.61% 3.50% 69.39% $48,583,504 $125,560,890 $4,185,364 3.25% 45.33% 3.50% 54.67% $48,583,504 $125,560,890 $4,185,363 Rate 100.00% $61,336,179 $172,268,389 $6,520,739 16.18% 100.00% $72,555,425 $213,359,606 $8,575,299 21.27% % of Option TotalInterest TotalDebt Service Annual Payment Tax Increase $12,752,674 $46,707,498 $2,335,375 $23,971,920 $87,798,715 $4,389,936
Townof CapeElizabeth, Maine TaxImpact From: To (w/HVAC): OptionE.2 $82,490,675 Construction 30 Years OptionE.2 $82,490,675 Construction 30 Years $52,962,356 Renovations 20 Years $135,453,031 $78,976,335 Renovations 20 Years $161,467,010 Amount Consolidated Consolidated Term 3.25% 39.10% $19,891,479 $72,853,835 $3,642,692 3.50% 60.90% $52,063,162 $134,553,837 $4,485,128 3.25% 48.91% 3.50% 51.09% $52,063,162 $134,553,837 $4,485,128 Rate 100.00% $71,954,641 $207,407,672 $8,127,820 20.16% 100.00% $81,724,911 $243,191,921 $9,917,032 24.60% % of Option TotalInterest TotalDebt Service Annual Payment Tax Increase $29,661,749 $108,638,084 $5,431,904 OptionF.1 $76,875,520 Construction 30 Years OptionF.1 $76,875,520 Construction 30 Years $38,271,920 Renovations 20 Years $115,147,440 $67,280,104 Renovations 20 Years $144,155,624 Amount Consolidated Consolidated Term 3.25% 33.24% $14,374,079 $52,645,999 $2,632,300 3.50% 66.76% $48,519,213 $125,394,733 $4,179,825 3.25% 46.67% 3.50% 53.33% $48,519,213 $125,394,733 $4,179,825 Rate 100.00% $62,893,292 $178,040,732 $6,812,125 16.90% 100.00% $73,788,119 $217,943,743 $8,807,275 21.85% % of Option TotalInterest TotalDebt Service Annual Payment Tax Increase $25,268,906 $92,549,010 $4,627,450 OptionF.2 $86,343,781 Construction 30 Years OptionF.2 $86,343,781 Construction 30 Years $48,291,791 Renovations 20 Years $134,635,572 $74,092,299 Renovations 20 Years $160,436,080 Amount Consolidated Consolidated Term 3.25% 35.87% $18,137,319 $66,429,110 $3,321,456 3.50% 64.13% $54,495,011 $140,838,792 $4,694,626 3.25% 46.18% 3.50% 53.82% $54,490,011 $140,833,792 $4,694,927 Rate 100.00% $72,632,330 $207,267,902 $8,016,082 19.89% 100.00% $82,317,425 $242,753,505 $9,790,913 24.29% % of Option TotalInterest TotalDebt Service Annual Payment Tax Increase $27,827,414 $101,919,713 $5,095,986 OptionG $148,964,860 Construction 30 Years OptionG $155,712,031 Construction 30 Years $29,227,214 Renovations 20 Years $178,192,074 $45,523,289 Renovations 20 Years $201,235,320 Amount Consolidated Consolidated Term 3.25% 16.40% $10,977,090 $40,204,304 $2,010,216 3.50% 83.60% $94,017,675 $242,982,535 $8,099,418 3.25% 22.62% 3.50% 77.38% $98,276,084 $253,988,115 $8,466,271 Rate 100.00% $104,994,765 $283,186,839 $10,109,634 25.08% 100.00% $115,373,615 $316,608,935 $11,597,312 28.77% % of Option TotalInterest TotalDebt Service Annual Payment Tax Increase $17,097,531 $62,620,820 $3,131,041 OptionColby Simons $157,646,206 Construction 30 Years OptionColby Simons $164,393,378 Construction 30 Years $29,227,234 Renovations 20 Years $186,873,440 $45,523,289 Renovations 20 Years $209,916,667 Amount Consolidated Consolidated Term 3.25% 15.64% $10,977,089 $40,204,323 $2,010,215 3.50% 84.36% $99,496,820 $257,143,026 $8,571,434 3.25% 21.69% 3.50% 78.31% $103,755,229 $268,148,607 $8,938,287 Rate 100.00% $110,473,909 $297,347,349 $10,581,649 26.25% 100.00% $120,852,761 $330,769,428 $12,069,328 29.94% % of Option TotalInterest TotalDebt Service Annual Payment Tax Increase $17,097,531 $62,620,820 $3,131,041
DEBT, OPERATIONS, AND CAPITAL FUNDING TOOL A consolidated debt, operations, and capital plan in use The elements of the plan contain: School Department operational budgets included, 10 year forecast Included instruction, special education, administration, facilities, etc. Existing debt service, maintenance, insurance, utilities were all part of forecast Town operational budgets included, 10 year forecast Included all operating budgets, debt service, sewer debt service, anticipated capital improvements, utilities, fuel costs, etc. School revenues of all forms included State aid to education, fees, revolving loan fund, etc. all included Town revenues of all forms included Sewer revenues, general revenues, use of fund balance, Homestead, BETE, etc. all included County Tax included
DEBT, OPERATIONS, AND CAPITAL FUNDING TOOL Swing space expenses and reimbursements included in plan Existing debt service is included New debt relating to each school project is included, with new debt coming on over a two year period as the project is constructed and funding needs established Net taxes to be raised identified Annual increase by each year identified Estimated that an average 4% per year as standard increase in taxes to be raised Net impact related to school project identified
CA PEELIZABETH CAPITALFUNDING PLAN 1/10/2024 Calculations Option A Totals 2024 Projections 2029 Budget Year 2025 2026 2027 2028 2030 2031 2032 2033 2034 SCHOOLDEPARTMENT $0 -$6,931,807 -$367,194 $54,893,211 $53,672,916 -$927,368 -$983,137 -$1,082,423 -$1,412,808 -$1,140,381 -$1,464,533 -$1,265,854 Expenses Operations (exl. Building Costs) $30,807,141 $0 $32,039,427 $33,321,004 $34,653,844 $36,039,998 $37,481,598 $38,980,861 $40,540,096 $42,161,700 $43,848,168 $45,602,094 Regular Instruction $15,870,599 SpecialEducation Career & Technical Other Instruction Student & Staff Support System Administration School Administration Transportation Facilities Other Debt Service Maintenance & Supplies Supplies 16,505,423 4,963,716 17,165,640 5,162,265 17,852,265 5,368,755 18,566,356 5,583,506 19,309,010 5,806,846 20,081,371 6,039,120 20,884,626 6,280,684 21,720,011 6,531,912 22,588,811 6,793,188 23,492,363 7,064,916 $4,772,804 $0 0 0 0 0 0 0 0 0 0 0 $1,055,436 $3,785,499 $769,401 $1,340,685 $999,935 $2,048,181 $164,601 $935,769 $65,000 $65,000 1,097,653 3,936,919 800,177 1,394,312 1,039,932 2,130,108 171,185 722,407 $36,681 67,600 1,141,560 4,094,396 832,184 1,450,085 1,081,530 2,215,313 178,032 541,044 $38,148 70,304 1,187,222 4,258,172 865,471 1,508,088 1,124,791 2,303,925 185,154 494,149 $39,864 73,116 1,234,711 4,428,498 900,090 1,568,412 1,169,783 2,396,082 192,560 401,390 $41,596 76,041 1,284,099 4,605,638 936,094 1,631,148 1,216,574 2,491,925 200,262 373,014 $43,401 79,082 1,335,463 4,789,864 973,538 1,696,394 1,265,237 2,591,602 208,273 299,320 $45,282 82,246 1,388,882 4,981,458 1,012,479 1,764,250 1,315,846 2,695,266 216,604 292,252 $47,243 85,536 1,444,437 5,180,717 1,052,978 1,834,820 1,368,480 2,803,077 225,268 285,184 $49,286 88,957 1,502,215 5,387,945 1,095,098 1,908,213 1,423,219 2,915,200 234,279 278,116 $51,417 92,515 1,562,303 5,603,463 1,138,901 1,984,541 1,480,148 3,031,808 243,650 189,771 $53,637 96,216 $390,078 Maintenance Savings $0 390078 -30,919 55,000 $1,034,221 $1,034,221 405,351 77,990 493,900 56,980 3,182 -32,156 57,200 $1,105,215 $1,105,215 413,458 85,789 543,290 62,678 3,309 -33,252 59,488 $1,182,660 $1,182,660 421,727 94,368 597,619 68,946 3,442 -34,445 61,868 $1,267,188 $1,267,188 430,162 103,805 657,381 75,840 3,545 -35,682 64,342 $1,359,494 $1,359,494 438,765 114,185 723,119 83,424 3,651 -36,964 66,916 -38,293 69,593 $1,570,573 $1,570,573 456,491 138,164 874,974 100,944 3,874 -39,671 72,376 $1,691,111 $1,691,111 465,621 151,980 962,471 111,038 3,990 -41,099 75,271 $1,822,972 $1,822,972 474,933 167,178 1,058,719 122,142 4,109 -42,579 78,282 $1,967,275 $1,967,275 484,432 183,896 1,164,590 134,356 4,233 Insurance Utilities $55,000 $1,022,090 $1,022,090 $450,390 $70,900 $449,000 $51,800 $673,115 $673,115 320985 $1,460,342 $1,460,342 447,540 125,604 795,431 91,767 Baseline Energy costs Electric Water/Sewer Oil 352130 Telephone Energycost savings $0 3,761 1,800,000 $12,562,500 12,562,500 1,518,566 1,579,309 1,642,481 1,708,181 1,776,508 1,847,568 1,921,471 Repairs* $1,285,000 25,125,000 Elligiblefor S R R FFunding Other Repairs SwingSpaceCosts $0 1,000,000 800,000 1,000,000 1,000,000 708,181 1,000,000 847,568 1,518,566 1,579,309 1,642,481 1,776,508 1,921,471 $1,285,000 12,562,500 $2,419,200 84,000 918,000 278,100 278,100 81,000 11,562,500 $1,612,800 84,000 952,000 288,400 288,400 84,000 $0 $3,680,000 84,000 $1,700,000 $515,000 $515,000 $150,000 $0 $0 $0 $0 $0 $0 $0 $0 Buidling SF Lease Utilities Maintenance Moving 0 0 0 0 0 7 of
Improvements Renovations* Elementary Item 1 Qualified 0 $800,000 864,000 $0 $0 $0 $0 $4,414,912 582,555 $4,414,912 582,555 $0 $0 $0 $0 $0 $0 $0 $0 $0 CleanEnergyImprovements Middle Item 2 Qualified $0 $0 CleanEnergyImprovements High School Item 3 Qualified 3,832,357 3,832,357 CleanEnergyImprovements NewConstruction* $0 $0 $0 $0 $32,358,075 $32,376,981 $0 $0 $0 $0 $0 $0 $0 Elementary Item 1 Qualified $0 29,709,653 29,709,653 $0 -$18,156 Efficiency Maine Incentive Qualified -$750 Efficiency Maine Incentive Middle $0 Item 2 Qualified $0 $0 CleanEnergyImprovements High School Item 3 Qualified 2,667,328 2,667,328 $0 $0 CleanEnergyImprovements Site Work* 6,111,713 6,111,713 Funding Current SchoolTaxes (FY2024) $30,572,289 31,795,181 33,066,988 34,389,667 35,765,254 37,195,864 38,683,699 40,231,047 41,840,289 43,513,900 45,254,456 $3,381,249 $3,019,211 3,550,312 3,727,827 3,914,218 4,109,929 4,315,426 4,531,197 4,757,757 4,995,645 5,245,427 State SchoolFunding Miscellaneous Fees $78,500 $78,500 $78,500 $78,500 $78,500 $78,500 $78,500 $78,500 $78,500 $78,500 $78,500 Carryover MEDOE SRRF $500,000 $500,000 $500,000 $500,000 $500,000 $500,000 $500,000 $500,000 $500,000 $500,000 $500,000 $0 $0 $300,000 $0 $300,000 $0 $0 $0 $300,000 $0 $300,000 $0 (School Revolving Renovation MEDOE MCSCP 0 0 0 0 0 0 0 0 0 0 $0 (Maj. Capital School Constr. Prog.) MEDOE LSP $0 $36,800,000 $0 $840,000 $840,000 $0 $0 $0 $0 $0 $0 $0 (Leased Space Program) USDOE RASP 8 of $0 $0 $0 $0 $0 $0 $0 $0 $0 $0 $0 (Renew America's Schools Prog.)
Other CleanEnergyProgram $0 $0 $0 $0 $0 $0 $0 $0 $0 $0 $0 (Eff. Maine) Private Funding 0 0 0 0 0 0 0 0 0 0 (For SpecialRenovation Projects) TOWN Expenses 0 0 -847,983 -262,746 -1,785,186 -2,122,098 -1,648,236 -1,181,989 -1,791,945 -2,220,874 -2,760,366 -2,760,394 16,640,000 1,075,416 219,563 1,485,848 $714,832 $534,376 250,628 17,165,640 843,193 219,563 1,345,432 $738,412 $550,738 255,640 17,852,265 598,729 18,566,356 420,727 19,309,010 318,748 20,081,371 310,961 20,884,626 303,174 21,720,011 295,387 22,588,811 287,557 23,492,363 279,638 Operating ExpenseCategory $16,000,000 Debt ServiceTown Debt ServiceSewer Capital Improvements Utilities Baseline Energy costs Electric Gas(Propane/NG) $1,137,521 $219,563 $940,822 $724,825 $551,310 $278,475 0 0 0 0 0 0 0 0 398,970 $762,836 $567,655 260,753 356,590 $788,134 $585,146 265,968 1,053,728 $814,340 $603,233 271,287 1,654,016 $841,488 $621,936 276,713 1,183,260 $869,613 $641,280 282,247 898,898 $898,753 $661,286 287,892 509,600 $928,945 $681,979 293,650 31,200 $960,230 $703,386 299,523 $0 $0 $0 0 0 0 0 0 0 0 0 0 0 Oil $272,835 283,748 295,098 306,902 319,178 331,945 345,223 359,032 373,394 388,329 403,862 Energycost savings Water/Sewer $0 $54,435 $119,080 $1,860,102 56,612 123,843 $1,934,506 58,877 128,797 $2,011,886 61,232 133,949 $2,092,362 63,681 139,307 $2,176,056 66,229 144,879 $2,263,098 68,878 150,674 $2,353,622 71,633 156,701 $2,447,767 74,498 162,969 $2,545,678 77,478 169,488 $2,647,505 80,577 176,267 $2,647,505 Tel/Data Current County TaxPayments Funding Current TownTaxes $7,878,568 8,193,711 8,521,459 8,862,318 9,216,810 9,585,483 9,968,902 10,367,658 10,782,364 11,213,659 11,662,205 (FY2024) Current County Taxes $1,860,102 1,934,506 2,011,886 2,092,362 2,176,056 2,263,098 2,353,622 2,447,767 2,545,678 2,647,505 2,647,505 (FY2024) FundSavings 1,200,000 (Grants, Efficiency Maine, FEMA) Other FundingSource (Sewer, General, Fund Bal., $11,144,164 11,589,931 12,053,528 12,535,669 13,037,096 13,558,579 14,100,923 14,664,960 15,251,558 15,861,620 15,861,620 Homestead, BETE) COMBINED(TOWN& SD) 0 -6,931,807 -1,215,177 54,630,465 51,887,730 -3,049,466 -2,631,372 -2,264,411 -3,204,752 -3,361,254 -4,224,899 -4,026,247 Additional Bonding Needed Additional Annual BondPayments Additional TaxesNeeded 0 0 0 -6,931,807 -1,215,177 -65,658 -65,658 40,708,221 101% -3.01% 54,630,465 2,951,753 2,951,753 46,552,086 114% 10.36% 51,887,730 5,755,312 5,755,312 51,099,659 110% 5.77% -3,049,466 5,590,546 5,590,546 52,748,666 103% -0.77% -2,631,372 5,448,369 5,448,369 54,492,814 103% -0.69% -2,264,411 5,326,020 5,326,020 56,332,243 103% -0.62% -3,204,752 5,152,863 5,152,863 58,199,335 103% -0.69% -3,361,254 4,971,251 4,971,251 60,139,582 103% -0.67% -4,224,899 4,742,974 4,742,974 62,118,038 103% -0.71% -4,026,247 4,525,431 4,525,431 64,089,597 103% -0.83% Annual TaxBase $40,310,959 Annual%TaxIncrease Net tax impact? 0 4% 12.34% Notes: * Costslisted areTotal Project Costs(inclusiveof contractor fees,professionalfeesandowner contingencies) Use4%construction inflation per year UseX* inflation for other costs Information provided by CapeElizabeth SchoolDepartment Assumptions for BudgetArticle increasesusing3.1%; insuranceincreae2%;utilities alsoat 2%;10%decreasefor utitlities; 5%increasefor state allocation 9 of
DRAFT IMPACT ON TAXES Forecast the impact of the project by utilizing Net amount to be raised in taxes, six year forecast beginning with current year Median home value employed Estimated overall value from revaluation employed Anticipated 0.5% annual growth in Town value Baseline annual increase of 4% forecast Forecast tax rates employ estimated net amount to be raised divided by overall value
PLEASE NOTE THAT THIS IS A DRAFT FORECAST The effort of this work is to review the entire financial structure of the Town, School, operational budgets, capital planning, existing and new debt Still very early in the process, and this analysis will evolve Currently there are seven options, as the process evolves to three and then to one recommendation this model will evolve Plans will change, additions and subtractions will take place to projects impacting costs Market conditions will also change for financing When the final option is selected, the model will provide a tool for estimating tax impact with a high level of confidence


![Town of [Town Name] Real Estate Tax Rates and FY 2024 Budget Summary](/thumb/62211/town-of-town-name-real-estate-tax-rates-and-fy-2024-budget-summary.jpg)