TDO2 Expression in Different Cancer Types: Immunohistochemical Analysis and Inhibition Effects
Explore the expression of TDO2 in various cancers using TCGA data. Supplementary figures delve into TDO2 inhibition effects, spheroid formation impact, and cell growth assessment. Immunohistochemical analysis and knockdown results provide insights into TDO2's role in cancer progression.

Download Presentation

Please find below an Image/Link to download the presentation.
The content on the website is provided AS IS for your information and personal use only. It may not be sold, licensed, or shared on other websites without obtaining consent from the author. If you encounter any issues during the download, it is possible that the publisher has removed the file from their server.
You are allowed to download the files provided on this website for personal or commercial use, subject to the condition that they are used lawfully. All files are the property of their respective owners.
The content on the website is provided AS IS for your information and personal use only. It may not be sold, licensed, or shared on other websites without obtaining consent from the author.
E N D
Presentation Transcript
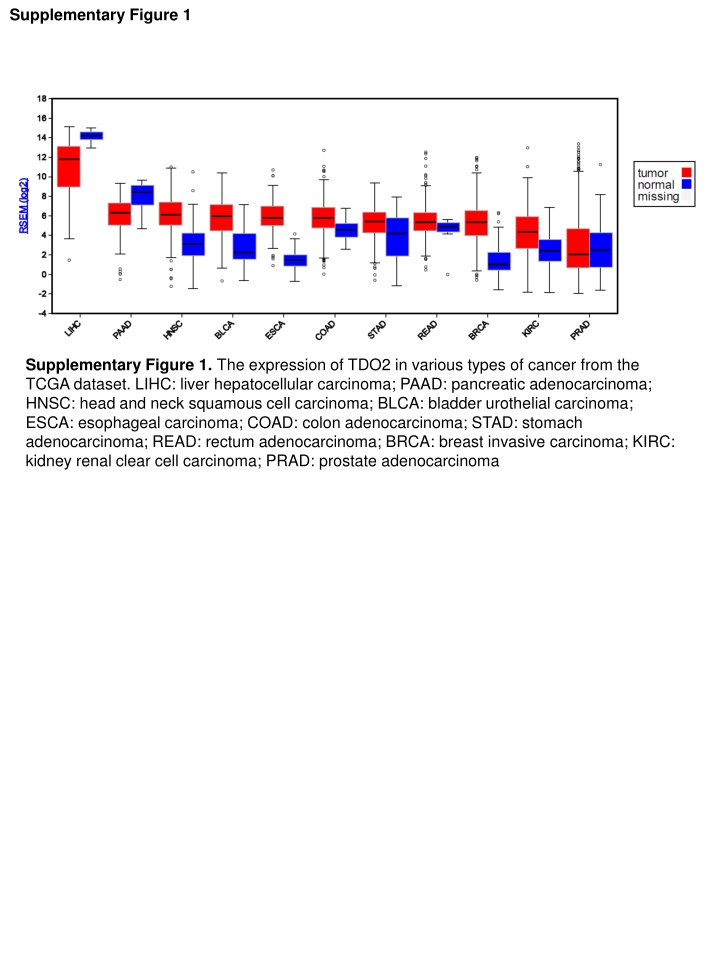
Supplementary Figure 1 Supplementary Figure 1. The expression of TDO2 in various types of cancer from the TCGA dataset. LIHC: liver hepatocellular carcinoma; PAAD: pancreatic adenocarcinoma; HNSC: head and neck squamous cell carcinoma; BLCA: bladder urothelial carcinoma; ESCA: esophageal carcinoma; COAD: colon adenocarcinoma; STAD: stomach adenocarcinoma; READ: rectum adenocarcinoma; BRCA: breast invasive carcinoma; KIRC: kidney renal clear cell carcinoma; PRAD: prostate adenocarcinoma
Supplementary Figure 2 a 0 1+ 2+ 3+ T classification N classification b c AUC=0.675 AUC=0.547 Recurrence Stage e d AUC=0.625 AUC=0.657 Supplementary Figure 2. Immunohistochemical analysis of TDO2 expression. (a) Immunoreactivity of TDO2 in tumor cells scored as 0 (no immunoreactivity) to 3+ (intense). Receiver operating characteristic curves for TDO2 expression score and (b) T classification, (c) N classification, (d) stage, and (e) recurrence. AUC, area under the curve.
Supplementary Figure 3 b 0.8 TE-10 a Parental cells Spheroid body-forming cells 0.00018 * * 0.00015 TDO2 expression level 0.6 CD44 expression level 0.00012 0.00009 0.4 0.00006 0.2 0.00003 0 Negative siRNA1 siRNA2 control 0 TE-1 TE-5 TE-10 TE-11 c TE-10 TE-10 * TE-10 * 40 120 * Negative control * 35 Number of spheres per field 100 Size of spheres ( m) 30 80 25 20 60 siRNA1 15 40 10 20 5 siRNA2 0 0 Negative Negative siRNA1 siRNA2 siRNA1 siRNA2 control control Supplementary Figure 3. Effect of TDO2 inhibition on spheroid formation. (a) CD44 mRNA is upregulated in spheroid body-forming cells compared with the parental cells in ESCC cell lines. (b) TDO2 mRNA expression was suppressed by siRNA transfection in TE10 cells. (c) The number and size of spheres from TE-10 cells transfected with the TDO2 siRNA or negative control siRNA. Bars and error bars indicate mean SD, respectively, of three different experiments. Black scale bar, 100 m. *p < 0.05.
Supplementary Figure 4 a c TE-10 TE-10 0.2 Negative siRNA2 siRNA1 0.18 control NC siRNA1 siRNA2 0.16 0.14 TDO2- * 0.12 O.D. 595 * EGFR- 0.1 0.08 pEGFR- 0.06 Akt- 0.04 0.02 pAkt- 0 day 0 day 1 day 2 day 4 Erk- TE-10 b 50 pErk- * * 40 -actin- Invaded cells number 30 Supplementary Figure 4. Effect of TDO2 inhibition on cell growth. (a) Effect of TDO2 knockdown on cell growth of TE-10 cells. Cell growth was assessed by MTT assays at 1, 2, and 4 days after seeding of siRNA- transfected TE-10 cells on 96-well plates. Bars and error bars indicate the mean and standard error. (b) Effect of TDO2 knockdown on the invasiveness of TE-11 cells as evaluated by modified Boyden chamber assays. Bars and error bars indicate the mean and SE, respectively, of three experiments. (c) Western blot analysis of TDO2 , epidermal growth factor receptor (EGFR), phospho-EGFR (pEGFR), Erk1/2, phospho-Erk1/2 (pErk1/2), Akt, and phospho- Akt (pAkt) in cell lysates from TDO2 cells transfected with TDO2 siRNA or negative control siRNA. -Actin was included as a loading control. *p < 0.05. 20 10 0 Negative SiRNA2 siRNA1 control


