Teaching Effectiveness Indicators & Graduation Rates
Explore the annual reporting measures, completers' impact on P-12 learning, indicators of teaching effectiveness, and graduation rates at an educational institution, based on various assessments and pass rates.
Download Presentation

Please find below an Image/Link to download the presentation.
The content on the website is provided AS IS for your information and personal use only. It may not be sold, licensed, or shared on other websites without obtaining consent from the author. If you encounter any issues during the download, it is possible that the publisher has removed the file from their server.
You are allowed to download the files provided on this website for personal or commercial use, subject to the condition that they are used lawfully. All files are the property of their respective owners.
The content on the website is provided AS IS for your information and personal use only. It may not be sold, licensed, or shared on other websites without obtaining consent from the author.
E N D
Presentation Transcript
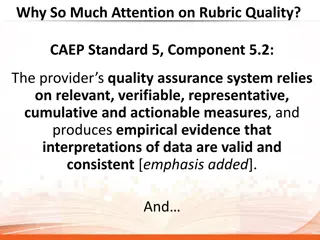
CAEPs 8 Annual Reporting Measures Presented to PEAC 10/30/19
Completers Impact on P-12 Learning and Development Tennessee Report Card 2017 Percentage of observation scores at Level 3 or above* Percentage of observation scores at Levels 4-5 Percentage of TVAAS scores at Level 3 or above* Percentage of TVAAS scores at Levels 4-5 CBU Average 97.8% 67.4% 64.5% 35.5% Overall Score ranges from 1 to 4 - CBU s score for 2018 = Level 4 in Impact on P-12 Learning and Development *Observation and TVAAS Scores range from Level 1 to Level 5 Level 3 Scores are At Expectations.
Indicators of Teaching Effectiveness edTPA Early Childhood Elementary Literacy 7 Elementary Math Middle English Language Arts Secondary History/ Social Studies Secondary English Language Arts *Secondary Math Special Education **World Language Pass Rate=96% n 7 Planning 15.14 15.71 13.67 22.0 Instruction 13.57 15.0 14.67 19.0 Assessment 14.29 16.29 17.0 20.0 Total 43.0 47.0 45.33 61.0 3 1 2 15.5 13.5 14.5 43.5 1 17.0 19.0 17.0 53.0 2 4 1 27/ 28 12.0 15.75 12.0 15.33 13.5 15.25 10.0 14.7 9.5 14.75 12.0 15.15 35.0 45.75 34.0 45.19
Indicators of Teaching Effectiveness Praxis Content Knowledge Exams Number Taking Assessment1 Number Passing Assessment2 Institutional Pass Rate Group Traditional Candidates All program completers, 2017-18 8 All program completers, 2016-17 8 All program completers, 2015-16 11 11 100% All program completers, combined 2015/16-2017/18 3 27 26 96%
Indicators of Teaching Effectiveness Praxis Content Knowledge Exams Number Taking Assessment1 Number Passing Assessment2 Institutional Pass Rate Group Alternative Candidates All program completers, 2017-18 8 All program completers, 2016-17 11 10 91% All program completers, 2015-16 9 All program completers, combined 2015/16-2017/18 3 28 27 96%
Graduation Rates Program Initial Licensure (B.A. & M.A.T.) Graduates/Admits M.Ed. Admits 2015 23/29 2016 14/24 2017 14/32** 2018* 21* 32/37 22/25 22/27 16* Leadership (Licensure/M.S.E.L.) Admits *Graduation rates do not include Fall 2018 admits Of 106 candidates admitted to initial licensure programs since Spring 2015, 54% graduated by December, 2018. Of 105 candidates admitted to the M.Ed. Program since Spring 2015, 88% graduated by December, 2018. Of 70 candidates admitted to the Leadership Program since Spring 2015, 41% graduated by December, 2018. 19 13 22 16*
Rate of Licensing 2014-2017 Data Rate of First-Year Employment in Tennessee Public Schools = 65.9%/79.34% Percentage of High-Demand Endorsements = 21.6%/26.95% (percentage of all endorsements issued in English as a Second Language, Secondary Math, Secondary Science, Spanish, and Special Education). Racially Diverse Completers = 31.8%/14.92%
Completer and Employer Surveys* Clinical Experience and Coaching/Mentoring 83.3%/88.35% Coursework and Faculty Expertise/Relationships 83.3%/85.49% Overall Preparation for Teaching in Their Current School Setting 83.3%/83.68% State Department is promising employer survey data will be available this fall *n = 6
Hiring Rates TN Report Card Rate of First-Year Employment in Tennessee Public Schools = 65.9%/79.34% Any Two-Year Employment Rate = 88.1%/94.55% Any Three-Year Employment Rate= 85.2%/92.16%
Loan Default Rates Loan default rate is tracked by the US Department of Education. The most recent reporting year was 2014, with a 3 year cohort default rate for the university of 9.1%.
Other Consumer Info Cost of attendance Undergraduate (full-time, per semester) $16,460.00 Graduate MAT, MEd, MSEL (per semester hour) $600.00 MAT 35 to 40 hours depending on licensure MEd 32 hours MSEL 32 hours First year teacher salaries (SCS) range from $40,873.15 (bachelor s degree) to $54,360.30 (doctorate).


