Temporal Cluster Analyses of Landslides Causing Damage in Switzerland
Study analyzing spatio-temporal patterns and clusters of landslides causing damage in Switzerland from 1995 to 2015. Utilizing methods like Ripley's K-function and Kernel Density Estimator to detect hotspot areas and factors contributing to landslide occurrences.

Download Presentation

Please find below an Image/Link to download the presentation.
The content on the website is provided AS IS for your information and personal use only. It may not be sold, licensed, or shared on other websites without obtaining consent from the author.If you encounter any issues during the download, it is possible that the publisher has removed the file from their server.
You are allowed to download the files provided on this website for personal or commercial use, subject to the condition that they are used lawfully. All files are the property of their respective owners.
The content on the website is provided AS IS for your information and personal use only. It may not be sold, licensed, or shared on other websites without obtaining consent from the author.
E N D
Presentation Transcript
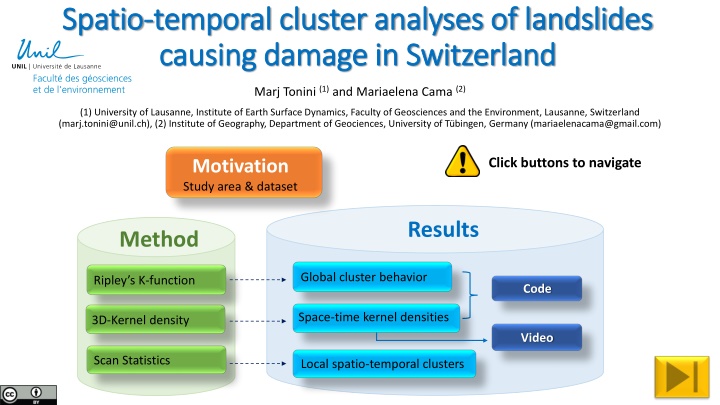
Spatio Spatio- -temporal cluster analyses of landslides temporal cluster analyses of landslides causing damage in Switzerland causing damage in Switzerland Marj Tonini (1)and Mariaelena Cama(2) (1) University of Lausanne, Institute of Earth Surface Dynamics, Faculty of Geosciences and the Environment, Lausanne, Switzerland (marj.tonini@unil.ch), (2) Institute of Geography, Department of Geociences, University of T bingen, Germany (mariaelenacama@gmail.com) Motivation Study area dataset Click buttons to navigate Motivation Study area & dataset Results Method Global cluster behavior Ripley s K-function Global cluster behavior Ripley s K-function Code Code Space-time kernel densities 3D-Kernel density Space-time kernel densities 3D-Kernel density Video Video Scan Statistics Local spatio-temporal clusters Scan Statistics Local spatio-temporal clusters
Motivations Motivations Cluster analysis represents a key tool in the investigation of spatio-temporal patterns of landslides, allowing to discover hotspot and recurrence which can help to detect predisposing factors. The present research analyses the spatio-temporal pattern distribution of landslides causing damage in Switzerlandin the last twenty years (1995-2015), with the aim of detecting if neighboring events are also closer in time, generating clusters. Total # of events = 1454 300 # of landslides events 250 200 150 100 50 0 1996 1997 1998 1999 2000 2001 2002 2003 2004 2005 2006 2007 2008 2009 2010 2011 2012 2013 2014 2015 Year Data source: National multitemporal damage database,implemented and provided by the Swiss Federal Institute for Forest, Snow and Landscape Research (WSL). Based on the analysis of historical information. (https://www.wsl.ch/en/natural-hazards.html)
Ripleys K function Ripley s K function The Ripley s K-function is a statistical exploratory analysis allowing detecting if a point process is or not randomly distributed. In its native spatial formulation, the ? ? function is defined as: 1 ? ? [? ? ? ?,? \ ? where ? represents the spatial intensity and ? the number of further events occurring within a distance ? of an arbitrary event ? ? ? = ? ?] The spatio-temporal ? ?,? function considers the distribution of events over a space-time cylinder with base of radius ? and height ? 1 ? ? [? ? ? ?,?,? \ ? ? ?,? = ? ?] If there is no space-time interaction, ? ?,? equals the product of the purely spatial and purely temporal K-function ? ?,? = ? ?,? [? ? ? ? ]
Kernel Kernel density estimator density estimator The Kernel density estimator (KDE) is a non-parametric descriptor tool widely applied in GIScience to elaborate smoothed density surfaces from spatial variables. It allows weighing up the contribution of each event (??), based to their relative distance ( * bandwidth ) to the target (?): ? 1 ? (? ?? ? ? = ? ) ?=1 The 3D-KDE includes the spatio-temporal dimensions: ? ?2 ? ???(? ?? 1 ,? ?? ?),??(? ?? ? ?,?,? = ?) ? KDE with different bandwidths of a random sample of 100 points from a standard normal distribution. Grey: true density (standard normal). Red: h=0.05. Black: h=0.337. Green: h=2. Source: https://en.wikipedia.org/w/index.php?curid=28979200 Results can differ depending on the bandwidth ? could provide a valid support to the choice of this value Spatio-temporal K-function
Scan Statistics Scan Statistics Spatio-temporal scan statistics permutation model (SaTScanTM) allows detecting clusters location and estimating their statistical significance. Cylindrical windows scan the area across the space and in time. For each cylinder are computed: The number of observed and expected occurrences The Likelihood Function (LF) The cylinder with the maximum LF is the Most Likely Cluster. Statistical inference (p-value): Generates random replicas of the dataset under the null hypothesis that observations are distributed randomly (Monte Carlo sampling). Compares the most likely clusters in the real and random datasets.
Global cluster behavior Global cluster behavior The perspective 3D-plot of D(s,t) provides a first diagnostic of space- time clustering, allowing inferring about the space-time interaction. Positive values indicate an interaction between these two variables at a well detectable scale. spatio-temporal Higher/increasing values indicate in our case a peak of clustering at 2 years and about 15 Km distance. These values were retained to define the Kernel bandwidth.
Yearly space Yearly space- -time Kernel density maps time Kernel density maps
Space Space- -time Kernel density 3D time Kernel density 3D- -map map
Local Local spatio spatio- -temporal clusters temporal clusters Results of scan-stactistics application show that the number of significant clusters decreases with the maximum radius, while they increase in extension. Even if more detailed analyses are required for the determination of cause-effect relationships among landslides and other variables, some relations with the local climatic and meteorological conditions can already be argued. For example, the rainfall event of August 2005, which triggered hundreds of landslides, is clearly highlighted by the cluster number 3c. At the smaller scale (cluster 4b), it is possible to define a longer period (circa 2 years) for the cluster duration. This could indicate a possible path dependency effects among fore-events and the main event of August 2005.
Code Code # Load library # Computes the space-time K-functions library(splancs) ST_LS <- stkhat(pts=pts_LS, times=Time_LS$Year, poly=polyg, c(1995,2015), seq(0,60,1), seq(0,10,1)) # Import Landslides 1995-2015 # Compute space-time Kernel density LS <- readShapeSpatial("Landslides") LSsp<-as.points(LS$x,LS$y) # Import limits of Switzerland LStime<-LS$Year Swiss <- readShapeSpatial("Swiss") stK3d_LS<-kernel3d(LSsp, LStime, seq(490000, 830000, 1000), seq(79000, 290000, 1000), seq(1995,2015,1), 15000, 2) b1 <- Swiss@polygons b2 <- b1[[1]] b3 <- b2@Polygons http://www.maths.lancs.ac.uk/~rowlings/Splancs/ b4 <- b3[[1]] polyg <- b4@coords/1000 # Extract Time and PTS object Time_LS <- data.frame(X=LS$x, Y=LS$y, Year=LS$Year) pts_LS <- cbind(Time_LS$X/1000, Time_LS$Y/1000)
References References Tonini, M.; Pereira, M. G.; Parente, J.; Vega Orozco C.; Evolution of forest fires in Portugal: from spatio-temporal point events to smoothed density maps; Nat Hazards (2017); 85:1489 1510 Tonini, M.; Pedrazzini A.; Penna I.; Jaboyedoff M.; Spatial pattern of landslides in Swiss Rhone Valley; Springer; Nat Hazards (2013); 73: 97 110 Pereira, M. G.; Caramelo, L.; Vega Orozco, C.; Costa, R.; Tonini, M.; Space-time clustering analysis performance of an aggregated dataset: The case of wildfires in Portugal; Environmental Modelling & Software (2015); 72:239-249 Cama, M.; Lombardo, L.; Conoscenti, C.; Rotigliano, E.; Improving transferability strategies for debris flow susceptibility assessment: Application to the Saponara and Itala catchments (Messina, Italy); Geomorphology (2017); 288: 52 65 Contact: marj.tonini@unil.ch