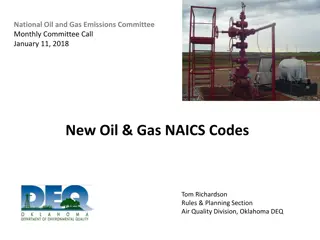
Texas Oil and Gas Activity Trends 2011-2017
"Explore graphed data on oil and gas activity in Texas from 2011 to 2017, including well counts, emissions, and future production estimates by geologic areas. Observations show trends in gas and oil wells, NOx and VOC emissions in different basins. Learn about the evolving landscape of the oil and gas industry in Texas."

Download Presentation

Please find below an Image/Link to download the presentation.
The content on the website is provided AS IS for your information and personal use only. It may not be sold, licensed, or shared on other websites without obtaining consent from the author. If you encounter any issues during the download, it is possible that the publisher has removed the file from their server.
You are allowed to download the files provided on this website for personal or commercial use, subject to the condition that they are used lawfully. All files are the property of their respective owners.
The content on the website is provided AS IS for your information and personal use only. It may not be sold, licensed, or shared on other websites without obtaining consent from the author.
E N D
Presentation Transcript
Graphing Oil and Gas Activity in Texas Graphed data from 2011 through 2017 Looked at well counts Gas wells Oil wells Looked at point source emissions NOx VOC Summed the data for each of the eight geologic areas of Texas Air Quality Division How Texas Estimates Future Oil and Gas Production MEE Nov. 9, 2017 Page 1
Texas gas wells Air Quality Division How Texas Estimates Future Oil and Gas Production MEE Nov. 9, 2017 Page 2
Texas oil wells Air Quality Division How Texas Estimates Future Oil and Gas Production MEE Nov. 9, 2017 Page 3
Texas Point Source NOx emissions Air Quality Division How Texas Estimates Future Oil and Gas Production MEE Nov. 9, 2017 Page 4
Texas Point Source VOC emissions Air Quality Division How Texas Estimates Future Oil and Gas Production MEE Nov. 9, 2017 Page 5
Observations Gas wells Eagle Ford Shale trending up All other basins steady or slightly decreasing Oil wells Permian Basin and Eagle Ford Shale have been increasing Other basins steady or decreasing until an uptick in 2017 NOx emissions Eagle Ford Shale increasing until 2015, then decreasing All other basins gradually decreasing VOC emissions Eagle Ford Shale increasing until 2015, then decreasing All other basins steady or slightly decreasing Air Quality Division How Texas Estimates Future Oil and Gas Production MEE Nov. 9, 2017 Page 6