The Changing Landscape of TB in Maryland: Epidemiology and Trends
The Maryland TB landscape in 2013 through epidemiological data, case rates, and characteristics, shedding light on origin, race, age, drug resistance, and risk factors. Dive into a detailed analysis of TB cases in Maryland, including trends, rates, and factors influencing the disease's prevalence. Understand the distribution of TB cases across various jurisdictions and the impact on different populations, with a focus on pulmonary versus extrapulmonary cases and foreign-born individuals.

Download Presentation

Please find below an Image/Link to download the presentation.
The content on the website is provided AS IS for your information and personal use only. It may not be sold, licensed, or shared on other websites without obtaining consent from the author.If you encounter any issues during the download, it is possible that the publisher has removed the file from their server.
You are allowed to download the files provided on this website for personal or commercial use, subject to the condition that they are used lawfully. All files are the property of their respective owners.
The content on the website is provided AS IS for your information and personal use only. It may not be sold, licensed, or shared on other websites without obtaining consent from the author.
E N D
Presentation Transcript
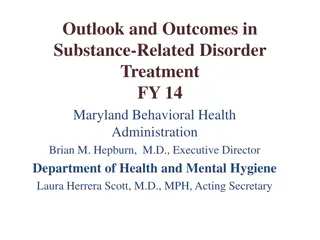
The Changing Landscape of TB: Maryland TB in 2013 Presented by Dr. David Blythe Lisa Paulos, RN MPH, Epidemiologist Center for TB Control & Prevention Public Health Promotion Administration Maryland Department of Health & Mental Hygiene TB Annual Meeting March 20, 2014
Presentation Outline Maryland TB Epidemiology (2013) Maryland TB numbers and trends Country of Origin Race Age Drug Resistance Risk Factors
Maryland TB, 2008-2013 300 6 250 5 200 4 Case Rate/100,000 Case Rate/100,000 Cases Cases 150 3 100 2 50 1 0 0 2008 2009 2010 2011 2012 2013 Cases Maryland
TB Case Rates, 2008-2013 6 5 4 3 2 2008 2009 2010 2011 2012 2013 National Maryland Counties Only* Baltimore City *Excluding Baltimore City
TB Case Rates per 100,000, United States, 2013* D.C. < 3.0 (2013 *provisional national average) >3.0 CDC, 3/20/2014
Maryland TB Case Rates, by Jurisdiction, 2013 Baltimore City Howard Montgomery Caroline Prince George s Counties with case rates 3.0/100,000
TB Characteristics, 2013 Pulmonary 100 cases (56%) Extrapulmonary 62 cases (35%) Extrapulmonary disease is seen more often in persons born outside of the U.S. Both pulmonary and extrapulmonary 16 cases (9%)
Percentage of TB Cases Among Foreign-born Persons, United States* 2002 2012 DC DC >50% 25% 49% <25% CDC, *Updated as of June 10, 2013
Country of Origin-Maryland, 2013 ETHIOPIA 13% All Other Countries 48% INDIA 12% EL SALVADOR 6% CAMEROON 6% NIGERIA 5% PHILIPPINES 5% BURMA 5%
Percent of TB cases by Origin, Maryland, 2011-2013 Baltimore City Maryland Counties 100% 100% 80% 80% 60% 60% 40% 40% 20% 20% 0% 0% US-born Foreign-born
MD TB Cases by Race and Origin, 2013 U.S. Born U.S. Born Foreign Born Foreign Born Hispanic 2% Other 2% Asian 8% White 6% Hispanic 17% White 38% Black 39% Black/A.A. 52% Asian 36%
Cases by Age Group Maryland, 2010-2013 120 100 80 Cases Cases 60 40 20 0 2010 2011 2012 2013 <5, 5-14, 15-24, 25-44, 45-64, 65+
TB in Children Children under 5 years old Not many cases, but Maryland has exceeded the national average for 3 years At high risk for TB meningitis Disease can progress quickly Important to find source case Sensitivity results Stop transmission Can represent undiagnosed adult cases
TB in MD Children 5 years of age, 2009-2013 10 3 9 2.5 8 Case Rate/100,000 Case Rate/100,000 7 2 6 Cases Cases 5 1.5 4 1 3 2 0.5 1 0 0 2009 2010 2011 2012 2013 Maryland Cases Maryland Rate
Case Rates in Young Children; Maryland vs. U.S. 3 2.5 2 1.5 1 0.5 0 2009 2010 2011 2012 2013 Maryland Rate National rate
MDR/XDR TB in Maryland, 2008-2013 5 1.6 1.4 4 1.2 1 Percentage Percentage 3 Cases Cases 0.8 2 0.6 0.4 1 0.2 0 0 2008 2009 2010 2011 2012 2013* *1 XDR case Cases Percent
Maryland Drug Resistance, 2013 178 cases total 122 (69%) cases: susceptibility results 21 (17%) cases: any resistance 1 (5%) MDR 1 (5%) XDR
Starting Treatment with 4 Drugs is Important! Maryland INH resistance (2013) is 10.7% National INH resistance (2012) is 9.2% U.S. born: 5.7% Foreign born: 10.7% 87% of eligible Maryland patients started treatment with 4 drugs in 2013. National goal is 93.4%
TB Risk Factors: Living and Occupational 2011 2011 2012 2012 2013 2013 National National* * Congregate Setting 6% 5% 3% 5.7% Homeless 1% 0.5% 0% 4.1% Corrections 1% 1% 1% 2.2% Long Term Care Occupation 6% 9% 3% 4% Health Care 3% 0.5% 0% 0.2% Correctional *2012 National Data
TB Risk Factors: Substance Use 2011 2012 2013 National* Injection Drug Use 0.5% 1% 0.6% 1.5% Non-injection Drug Use 2% 3% 2% 7.4% Excess Alcohol Use 5% 7.5% 5% 12.4% *2012 National Data
TB HIV Co-Infection Trends, 2009-2013 14 12 10 8 Percent Percent 6 4 2 0 2009 2010 2011 2012 2013 Percent Linear (Percent)
TB HIV Co-Infection, Origin of Birth 14 12 10 8 Percent Percent 6 4 2 0 2012 2013 US Born Foreign Born
TB and Diabetes 40 16 35 14 30 12 25 10 Percentage Percentage 20 8 Cases Cases 15 6 10 4 5 2 0 0 2009 2010 2011 2012 2013 Cases Percent