The Role of Local Authorities in Community-Led Housing
Local authorities play a vital role in supporting community-led housing initiatives by providing strategic support, facilitating partnerships, identifying land and buildings, and offering funding support. Community-led housing helps address housing needs, empowers residents, and contributes to regeneration efforts. This form of housing is diverse, catering to different income levels and tenures, including new builds and refurbishments. Resources and guidance are available to assist in developing community-led homes, emphasizing the importance of grassroots involvement and collaboration with existing organizations.
Download Presentation

Please find below an Image/Link to download the presentation.
The content on the website is provided AS IS for your information and personal use only. It may not be sold, licensed, or shared on other websites without obtaining consent from the author.If you encounter any issues during the download, it is possible that the publisher has removed the file from their server.
You are allowed to download the files provided on this website for personal or commercial use, subject to the condition that they are used lawfully. All files are the property of their respective owners.
The content on the website is provided AS IS for your information and personal use only. It may not be sold, licensed, or shared on other websites without obtaining consent from the author.
E N D
Presentation Transcript
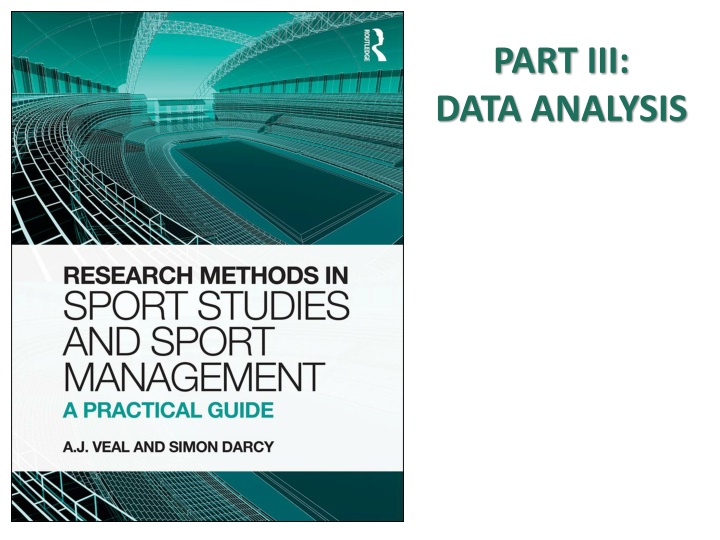
PART III: DATA ANALYSIS
Structure PART II DATA COLLECTION PART III ANALYSIS PART I PREPARATION 7. Secondary data 14. Secondary 1. Introduction 8. Observation 2. Approaches 9. Qualitative 15. Qualitative 3. Starting out 10. Questionnaires 16. Survey data 4. Research ethics 11. Experimental 17. Statistical 5. Range of methods 12. Case studies PART IV COMMUICATE RESULTS 6. Reviewing lit. 13. Sampling 18. Research report
Chapter 14: Analysing secondary data
CONTENTS This chapter comprises 5 case studies dealing with: 14.1. The Spirit Level and sport: International data on income inequality and sport participation 14.2. Estimating demand for a sports facility 14.3. Facility utilisation 14.4. Facility catchment or market area 14.5. Olympic medals 14.6. The colour red and sporting success
Childrens play safety (CS 11.6A) Secondary data: reports of accidents in school playgrounds in Toronto (collected routinely for insurance etc. purposes) 86 playgrounds deemed unsafe and provided with new equipment = treatment group 225 playgrounds deemed safe: no action taken = control group Injuries per 1000 students for 10 months before and after the replacement of equipment. Treatment group: Injury rates declined. Control group: Injury rates actually increased. A. J. Veal & S. Darcy (2014) Research Methods for Sport Studies and Sport Management: A practical guide. London: Routledge
CS 14.1 The Spirit Level and sport The Spirit Level Wilkinson & Pickett (2009): secondary data from UN etc. countries with more equal income distribution perform better on a wide range of human welfare measures sport not covered Sport participation data explored here A. J. Veal & S. Darcy (2014) Research Methods for Sport Studies and Sport Management: A practical guide. London: Routledge
Income inequality & sport participation: Europe, 2009 (Fig. 14.1) 100 R = 0.3748 DEN 90 SWE NL % participating in sport 80 GER FIN FRA IRE UK AUT SPA 70 60 BEL GRE 50 POR 40 ITA 30 3.0 4.0 5.0 Income distribution 6.0 7.0 8.0 9.0 More equal More unequal A. J. Veal & S. Darcy (2014) Research Methods for Sport Studies and Sport Management: A practical guide. London: Routledge
CS 14.2 Estimating demand for a sports facility D. Typical facility capacity H. No. of new facilities to cater for unmet demand E. Capacity of existing facilities A. G. Age-specific participation rates (National Survey) F. Unmet demand Compare C. Estimate total demand from local population B. Population by age- groups (Census) A. J. Veal & S. Darcy (2014) Research Methods for Sport Studies and Sport Management: A practical guide. London: Routledge
Estimating demand for a sports facility contd C. Secondary data: National survey + Census D. Estimated total demand: 4600 visits per week D. Typical facility capacity: 500 visits/week E. Capacity of 4 existing facilities: 2000 visits/week F. Comparison: 4600 and 2000 visits/week G. Unmet demand: 2600 visits/week H. No. of new facilities to cater for unmet demand: 2600/500 = 5.2. Five courts. A. J. Veal & S. Darcy (2014) Research Methods for Sport Studies and Sport Management: A practical guide. London: Routledge
CS 14.3 Facility utilisation Secondary data: ticket/bookings data for different areas in a multi-purpose facility See Table 14.4 and Fig. 14.4 A. J. Veal & S. Darcy (2014) Research Methods for Sport Studies and Sport Management: A practical guide. London: Routledge
Facility utilisation contd (Fig. 14.3) 100.0 90.0 80.0 70.0 % Utilised 60.0 Area A 50.0 Area B 40.0 Area C 30.0 20.0 10.0 0.0 Mon Tues Wed Thurs Fri Sat Sun A. J. Veal & S. Darcy (2014) Research Methods for Sport Studies and Sport Management: A practical guide. London: Routledge
CS 14.4 Facility catchment area: Secondary data: customer address data from bookings or membership records See Fig. 14.4 A. J. Veal & S. Darcy (2014) Research Methods for Sport Studies and Sport Management: A practical guide. London: Routledge
Facility catchment area contd (Fig. 14.4) 2 km 4 km Facility One member A. J. Veal & S. Darcy (2014) Research Methods for Sport Studies and Sport Management: A practical guide. London: Routledge
CS 14.5 Olympic medals Measuring countries success/rank order: Gold medals won Total medals, gold, silver and bronze, won Points: for example: gold = 3 points, silver = 2 points, bronze = 1 point Medals per million population Points per million population Medals per $billion GDP Points per $billion GDP Medals per $1000 GDP per head Points per $1000 GDP per head A. J. Veal & S. Darcy (2014) Research Methods for Sport Studies and Sport Management: A practical guide. London: Routledge
London 2012 Olympic Games: top 10 gold medal winners (Table 14.6) Gold medal rank United States China Great Britain 1 2 3 4 5 6 7 8 9 Russia South Korea Germany France Italy Hungary Australia 10 A. J. Veal & S. Darcy (2014) Research Methods for Sport Studies and Sport Management: A practical guide. London: Routledge
Ranks on 9 measures of performance (Table 14.7) Medals per million popn Medals per $bn GDP Medals per $000 GDP/ head Medals Gold 1 2 3 4 5 6 7 8 9 10 Total 1 2 4 3 9 5 8 10 15 7 Points 1 2 4 3 9 5 6 10 12 8 Medals 49 75 20 32 33 37 38 41 7 8 Points Medals Points Medals Points 44 66 8 69 67 2 18 41 10 31 36 5 30 47 20 34 54 15 33 50 22 37 53 26 5 16 21 9 35 30 United States China Great Britain 9 2 11 5 26 17 23 25 24 31 8 2 10 5 20 15 22 26 21 30 Russia South Korea Germany France Italy Hungary Australia A. J. Veal & S. Darcy (2014) Research Methods for Sport Studies and Sport Management: A practical guide. London: Routledge
CS 14.6 The colour red and sporting success Hill and Barton (2005): Red = maleness in many animals Anger associated with red Analysis of 4 combat sports in the 2004 Olympics, where contestants are randomly assigned red and blue outfits. Contestants wearing red consistently won more fights. Confirmed using English soccer league data from 1947- Challenged by Rowe et al. See also CS 11.6b A. J. Veal & S. Darcy (2014) Research Methods for Sport Studies and Sport Management: A practical guide. London: Routledge
