The Voice of the European Service Industries: Trade Dynamics and Economic Impact
Significance of trade in services between the EU and Thailand in January 2023. Delve into the economic impact of service industries on GDP, trade shares, and global export rankings. Analyze the EU's leading role as a global exporter of services and its top trading partners. Understand the importance of trade in services for economic growth and international trade negotiations.
Download Presentation

Please find below an Image/Link to download the presentation.
The content on the website is provided AS IS for your information and personal use only. It may not be sold, licensed, or shared on other websites without obtaining consent from the author.If you encounter any issues during the download, it is possible that the publisher has removed the file from their server.
You are allowed to download the files provided on this website for personal or commercial use, subject to the condition that they are used lawfully. All files are the property of their respective owners.
The content on the website is provided AS IS for your information and personal use only. It may not be sold, licensed, or shared on other websites without obtaining consent from the author.
E N D
Presentation Transcript
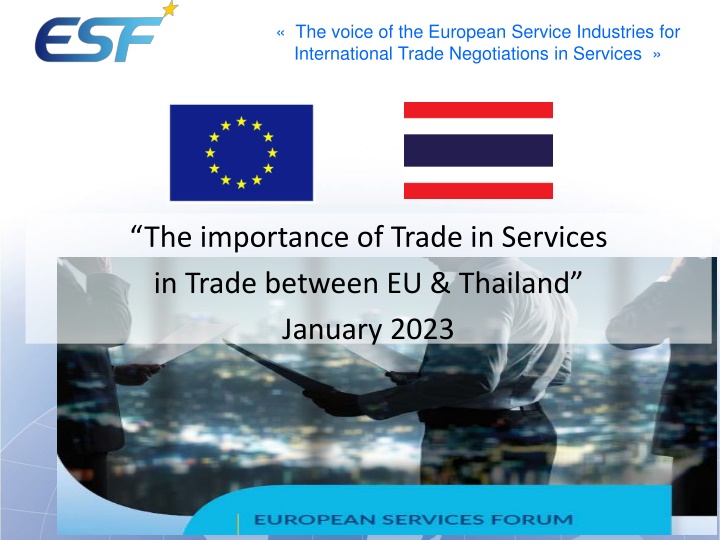
The voice of the European Service Industries for International Trade Negotiations in Services The importance of Trade in Services in Trade between EU & Thailand January 2023
The voice of the European Service Industries for International Trade Negotiations in Services EU Economy per sectors GDP (est. 2017) 90 80 79.2 Services = 73% of EU GDP 55% of Thai GDP (A rather low level for an emerging country) 80 73.3 72.7 70 61.6 60 55.6 51.6 50 40.5 36.2 40 30 25.1 23 20.7 20.2 19.1 15.4 20 7.9 8.2 6.6 10 1.6 0.9 0.7 0 agriculture Industry Services EU UK China Brazil India USA Thailand Source: CIA FactBook - 2021
The voice of the European Service Industries for International Trade Negotiations in Services The share of Trade in Services in the EU GDP is higher than in other high income countries! 27.3% (20.9% in Thailand) Trade in Services (GDP) (%) 35 European Union High Income Middle Income Low Income Thailand 30 30 27.6 25.4 26.4 26 25.5 25.8 25.3 25 18.9 20.9 20 15.3 18.3 16.5 15.2 15 14.6 12.2 12.8 8.4 11.4 10.7 10 8.4 9 9.7 8.6 8.6 7.5 6.8 6.6 8.1 5 0 2009 2010 2011 2012 2013 2014 2015 2016 2017 2018 2019 2020 2021 2022 Source: World Bank
TOP 20 WORLD EXPORTERS 2568 The voice of the European Service Industries for International Trade Negotiations in Services OF TRADE IN SERVICES 2500 2017 2018 2019 2020 2021 2022 2000 EU is the first largest global exporter of services 1500 1325 Thailand is the 22nd largest global exporter of services 1000 897 487 500 422 313 291 163 154 151 129 122 93 90 84 58 51 50 48 38 0 Total World Export of services 2022 (excl. Intra EU) = 5833 Bio US$ - trade outlook 2022 Bio US$ Source: WTO Trade Statistical Review & Global
The voice of the European Service Industries for International Trade Negotiations in Services TOP 25 EU TRADING PARTNERS IN SERVICES TOP 25 EU TRADING PARTNERS IN SERVICES - - (EXTRA (EXTRA- -EU27) EU27) 2022 2022 - - BIO BIO 684 55,00052.4 THAILAND IS 22ND EU TRADING PARTNER 500,000 398,534 47.6 444.1 28 41.4 45,000 400,000 40 35.9 196,094 35,000 26 28.6 300,000 26.5 25.8 24.2 218.2 25,000 21.3 7.6 200,000 9.4 16.7 6.4 16.7 79,160 285,498 13.3 108.3 15,000 10.8 247,998 8.1 57.6 100,000 7.6 45,888 139,111 5,000 32,443 62,403 25,149 0 -5,000 EU27 Exports EU27 Imports Source: Eurostat bop_its6_det.
The voice of the European Service Industries for International Trade Negotiations in Services IMPORTANCE OF TRADE IN SERVICES EU27 (Extra EU) Comparison between Balance of Payment (BoP) & Trade in Value Added TiVA EU Exports in TiVA - 2016 - % EU Exports in BOP - 2022 Bio$ 32.9% 67.1% 41.1 1325 58.9 2704 Goods Services Goods Services Total Export Extra EU27= 4029 $Bio Source: WTO WTS2020 & OECD/WTO TiVA
The voice of the European Service Industries for International Trade Negotiations in Services IMPORTANCE OF TRADE IN SERVICES in Thailand Comparison between BoP & TiVA Thailand Exports in TiVA - 2016 - % - Thailand Exports in BOP - 2021 Bio US$ - % - 11.7% 88.3% 38 43.3 56.7 287 Goods Services Goods Services Total Export EU= 325$Bio Source: WTO WTS2018 & TiVA
The voice of the European Service Industries for International Trade Negotiations in Services EU27-Thailand Trade & Investment (Imports and exports of goods & services & FDI) Trade in Goods ( Bio) 22,205 Trade in Services ( Bio) 3142 18,92219,63519,63517,938 13,59813,500 25,000 7000 5766 4590 5650 5548 5448 20,000 6000 4953 13,55111,42213,322 5000 15,000 3268 3250 2685 4000 2507 10,000 3000 2000 5,000 511 1000 0 0 2017 2018 2019 2020 2021 -5,000 -1000 2017 2018 2019 2020 2021 -5,324 -6,135-6,133 -6,516-8,883 -2000 -10,000 -1175 -433 -3000 -2198 -15,000 EU Imports EU Exports Balance EU Imports EU Exports Balance EU27 Total trade balance with Thailand ( Bio) 0 2017 2018 2019 2020 2021 -3831 -5741 -6566 -7522 -7310 -10000 Balance Goods & Services Source: Eurostat - [ext_lt_maineu] + [bop_its6_det]
The voice of the European Service Industries for International Trade Negotiations in Services IMPORTANCE OF TRADE IN SERVICES IN THE EU27 IMPORTANCE OF TRADE IN SERVICES IN THE EU27- -THAILAND TRADE RELAT THAILAND TRADE RELATIONSHIP IONSHIP Services represent only 18.6 % of the total trade between EU & Thailand Services represent only 18.6 % of the total trade between EU & Thailand (29.8% of EU exports to Thailand = Services) (29.8% of EU exports to Thailand = Services) EU & Thailand Total volume of trade 2021 Bio - % EU Exports to Thailand - 2021 - Bio Thailand Exports to EU - 2021 - Bio 81.3% 18.6% 70.2% 10.1% 89.8% 29.8% 2,507 8,157 5,650 13,322 35,527 22,205 Goods Services Total exports: 18,972 Bio Total exports: 24,712 Bio Total exports: 43,684 Bio Source: Eurostat
The voice of the European Service Industries for International Trade Negotiations in Services EU27 and UK Trade in Services with Thailand (Mio - 2010-2019) 7,000 EU surplus: +3143 Mio EU Exports: 154% in 11 years EU Imports: -40% in 11 years 5,766 6,000 5,449 5,214 5,650 5,548 4,645 4,871 4,738 5,115 5,000 4,273 4,953 4,590 4,233 4,000 3,250 2,807 2,969 3,268 2,565 2,676 3,000 2,277 2,224 2,507 IMPACT OF BREXIT: 2019 UK = 21% of EU Exports of Services; and 18% of EU Imports! 2,000 1,230 1,3 1,2 1,062 1,052 990 1,023 842 762 1,000 857 1,019 754 681 761 1,019 648 554 592 0 2011 2012 EU Exports 2013 2014 2015 2016 2017 2018 2019 2020 2021 EU Imports UK Exports UK Imports Source: Eurostat bop_its6_det.
The voice of the European Service Industries for International Trade Negotiations in Services EU27 Services Exports and Imports with Thailand per sectors (2019 - Million) 4000 Exports - Total 4 789 Imports - Total: 5 596 3500 3391 3000 60% of Thailand Exports 2500 2000 31 % of EU Exports 1500 16.9 % 24 % 1493 17 % 1196 1000 945 9.5 % 817 792 8 % 500 105 391 124 457 140 63 32 73 39 42 19 26 17 11 33 37 22 16 0 Source: Eurostat 2020 Note: Other business services comprise mainly: research and development, professional and management consulting services, technical, trade-related services. Statistic figures for EU27 not available yet.
The voice of the European Service Industries for International Trade Negotiations in Services EU27 Services Exports and Imports with Thailand per sectors (2021 - Million) 2500 Exports - Total 5 650 Imports - Total: 2 507 37.5 % of EU Exports 2115 2000 23.3 % 1500 1318 18.6 % 37% of Thailand Exports 1000 1052 928 22.9 % 22.7 % 7 % 500 575 571 3.1 % 2.9 % 399 100 159 164 179 71 41 27 13 36 38 35 10 99 28 40 16 18 0 Source: Eurostat 2020 Note: Other business services comprise mainly: research and development, professional and management consulting services, technical, trade-related services. Statistic figures for EU27 not available yet.
The voice of the European Service Industries for International Trade Negotiations in Services EU29 - Foreign Direct Investment with Thailand ( Mio) 25,000 19,999 17,595 19,693 18,719 20,000 18,138 17,144 14,716 17,137 16,229 15,424 16,195 13,250 15,000 15,745 13,724 9,616 10,000 9,156 5,000 3,948 2,490 2,714 2,428 460 3,804 458 0 -474 2013 2014 2015 2016 2017 2018 2019 2020 -5,000 Inward Stocks Outward Stocks Balance
