Theory of Constraints in Production Planning Example
Explore a production planning problem at Hitchcock-Kubrick-Lean Inc., where two teams propose product mix plans to maximize profit using standard cost accounting. Learn about direct labor costs, overhead allocations, and profit calculations in this practical example.
Download Presentation

Please find below an Image/Link to download the presentation.
The content on the website is provided AS IS for your information and personal use only. It may not be sold, licensed, or shared on other websites without obtaining consent from the author. If you encounter any issues during the download, it is possible that the publisher has removed the file from their server.
You are allowed to download the files provided on this website for personal or commercial use, subject to the condition that they are used lawfully. All files are the property of their respective owners.
The content on the website is provided AS IS for your information and personal use only. It may not be sold, licensed, or shared on other websites without obtaining consent from the author.
E N D
Presentation Transcript
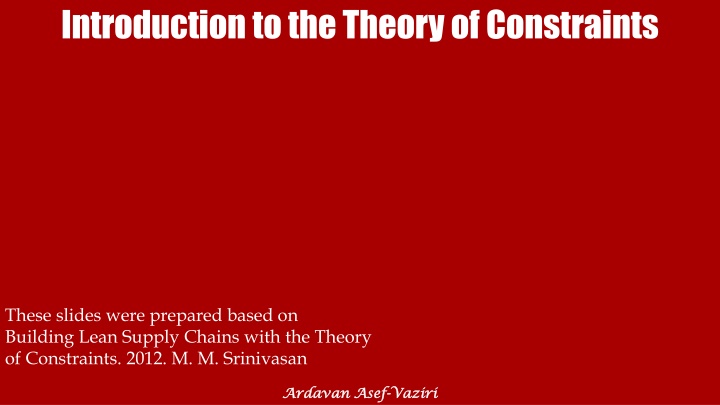
Introduction to the Theory of Constraints These slides were prepared based on Building Lean Supply Chains with the Theory of Constraints. 2012. M. M. Srinivasan Ardavan Asef Ardavan Asef- -Vaziri Vaziri
A Production Planning Problem Hitchcock-Kubrick-Lean Incorporation has 5 line employees. Wage per employee is $2,000 including benefits. Hours budgeted per employee per month = 200 hours. Monthly Administrative Overhead (Salaries) = $18,000. Monthly Non-Administrative Overhead (Rent, Truck Fleet Maintenance, Marketing, Depreciation) = $9,000. Total Direct Labor cost per month is $10,000. Direct labor rate = $10,000/1,000 = $10 per hour. Other information is given below. Plumbing (Product-1), Window Cleaning (Product-2), Gutter Guard Installation (Product-3), and Landscaping (Product-4). ` Demand Revenue /Job Material Cost /Job Labour Hours/Job Current Output Product-1 Product-2 Product-3 Product-4 250 160 $130 $170 $30 $10 2 4 90 70 Labor hours/month Labor cost /month (5 Workers) Labor cost per hour Administrative Overhead Non-Administrative Overhead 1000 10000 145 $200 $70 3 80 120 $250 $75 5 60 10 18000 9000 Introduction to the Theory of Constraints- An Accounting Example 2
A Production Planning Problem HKL is currently completing an average of 90 units of Product-1, 70 units of Product-2, 80 units of Product-3, and 60 units of Product-4 per month. For this level of output, HKL uses up (90 2 + 70 4 + 80 3 + 60 5) = 1,000 hours of labor, and that effectively accounts for all the available capacity. HKL assigns labor costs to the four products as follows: Product-1 takes 2 hours per unit and so the labor cost is $10 x 2 = $20 per unit of Product-1. The labor costs for the other three products are, $40, $30, and $50, respectively. HKL has hired two team of consultant for product mix planning. One is using standard cost accounting (the other team uses activity based accounting) to allocate the administrative and non-administrative overhead costs. You are a member of one of these teams. They are expected to propose a production plan (product mix) to maximize profit. Introduction to the Theory of Constraints- An Accounting Example 3
Standard Cost Accounting Standard cost accounting allocates indirect costs to products based on the volume of the cost driver they have consumed. There may be more than one single cost driver such as labor cost, number of jobs, etc. The cost driver chosen by this team is the monthly production volume. Currently HKL is completing (90 + 70 + 80 + 60) = 300 jobs a month. Each job is allocated an administrative overhead cost of $18,000/300 = $60. Each job is allocated a non-administrative overhead cost of $9,000/300 = $30. Introduction to the Theory of Constraints- An Accounting Example 4
Standard Costing Computations Product-1 Product-2 Product-3 Product-4 250 160 90 70 130 170 30 10 2 4 20 40 60 60 30 30 Total Formulas Demand Current Output Revenue/unit Material Cost/unit Labour Hours/unit Labor Cost/unit Administrative/unit Non Administrative/unit 145 80 200 70 3 30 60 30 120 60 250 75 5 50 60 30 300 1000 10000 18000 9000 B7=B6*$F$7/$F$6 B8=$F$8/$F$3 B9=$F$9/$F$3 Profit/unit -10 30 10 35 4100 B10=B4-B5-B7-B8-B9 HKL is using all its labor capacity, and is absorbing all overheads. So there is no labor variance or overhead absorption variance to worry about. Total Profit = 90(-$10) + 70($30) + 80($10) + 60($35) = $4,100. Introduction to the Theory of Constraints- An Accounting Example 5
Standard Cost Accounting-Quest for Maximum Profit Prod-4 generates the highest profit of $35 per unit, lets produce as much as we can. Resource per unit =5. Total resource available =1000. Capacity = 1000/5 = 200. Demand = 120. Production = Min{200,120} = 120. External Constraint. Product 4 generates 35(120) = $4200 profit. Capacity used = 5(120) = 600. Remaining capacity = 1000- 600 = 400. Prod-2 generates the next highest profit of $30 per unit. Lets produce as much as we can. Resource per unit =4, Total resource available =400. Capacity = 400/4 = 100. Demand = 160. Produce Min{160,100} =100 Internal Constraint. Introduction to the Theory of Constraints- An Accounting Example 6
Standard Cost Accounting-Quest for Maximum Profit Product 4 generates 30(100) = $3000 profit. Total profit 4200+3000 = $7200. Do you really make this much profit? Lets check. Introduction to the Theory of Constraints- An Accounting Example 7
Standard Cost Accounting Recommendation Make ZERO Profit Product-1 Product-2 Product-3 Product-4 250 160 0 100 130 170 30 10 2 4 20 40 81.82 40.91 172.73 -2.73 Total Demand Stanndat Acct. Proposal Revenue /unit Material Cost /unit Labour Hours/unit Labor Cost /unit Administrative /unit Non Administrative /unit Cost/unit Profit/unit Instead of 7200 Profit, We have 0 Profit. With original plan we had 4100 Profit. 145 0 200 70 3 30 120 120 250 75 5 50 81.82 40.91 247.73 2.27 220 F3=SUM(B3:E3) 1000 10000 18000 9000 37000 0.00 B7=B6*$F$7/$F$6 B8=IF(B$3=0,"",$F$8/$F$3) B9=IF(B$3=0,"",$F$9/$F$3) B10=IF(B3=0,"",B5+B7+B8+B9) B11=IF(B3=0,"",B4-B10) Introduction to the Theory of Constraints- An Accounting Example 8
Standard Costing is Not a Good Production Planning Tool It is easy to see this. Revenue = 120(250)+100 (170)= 47000 Material Cost = 120(75)+100(10) = 10000 We could have also said Financial throughput = 120(250-75)+100 (170-10)= 37000 Fixed Costs = 10000+18000+9000 = 37000 The activity based costing (ABC) team (the second accounting team) gathers data on the actual time the three administrators spend on the various products. The data shows that the administrators allocate their time as follows: Product-1 30%; Product-2: 35%; Product-3: 20%; and Product-4: 15%. The ABC group uses labor hours as the cost driver to allocate the non-administrative overhead cost. That is $9,000/1,000 = $9 per labor hour. Introduction to the Theory of Constraints- An Accounting Example 9
Activity Based Costing vs Standard Costing Product-1 Product-2 Product-3 Product-4 250 160 90 70 130 170 30 10 2 4 20 40 0.3 0.35 5400 6300 60 90 18 36 128 176 2 -6 -10 30 Total 675 300 Formulas Demand Current Output Revenue /unit Material Cost /unit Labour Hours/unit Labor Cost /unit Administrative - % Allocated Administrative - Allocated Administrative /unit Non Administrative /unit Cost/unit Profit/unit 145 80 200 70 3 30 0.2 3600 45 27 172 28 10 120 60 250 75 5 50 0.15 2700 45 45 215 35 35 1000 10000 1 18000 18000 9000 50500 4100 4100 B7=B6*$F$7/$F$6 B9=B8*$F$9 B10=IFERROR(B9/B3,"") B11=($F$11/$F$6)*B6 B12=B5+B7+B10+B11 Introduction to the Theory of Constraints- An Accounting Example 10
Can HKL Do Better? Let s use ABC figures to find the most profitable product mix. Product-4 generates the highest profit of $35 per unit, lets produce as much as we can. Resource per unit =5, Total resource available =1000. Capacity = 1000/5 = 200. Demand = 120. Produce Min(200,120) =120. External Constraint. Product 4 generates 35(120) = $4200 profit. Capacity used = 5(120) = 600. Remaining capacity = 1000- 600 = 400. Product-3 generates the next highest profit of $28 per unit, lets produce as much as we can. Resource per unit =3, Total resource available =400. Introduction to the Theory of Constraints- An Accounting Example 11
Can HKL Do Better? Capacity = 400/3 = 133.33. Demand = 145. Produce Min{133.33,145} =133.33 =133. Internal Constraint. Product 3 generates 28(133) = $3724 profit. Total profit 4200+ 3724 = $7924. Do you really make this much profit? No. Why? Total Revenue = 120(250-75)+133(200-70) = 38290 Total Cost = 10000+18000-9000 = 37000 Profit = 38290 37000 = 1290 Why? Introduction to the Theory of Constraints- An Accounting Example 12
Activity Based Costing is Not a Good Production Planning Tool. There are Unabsorbed overheads. 120 Prod-1 and 133 Prod-2 will each recover $45 of Administrative Overhead, that is: $45 x 120 + $45 x 133 = $11,385. Admin. Overhead Variance = $18,000 - $11,385 = $6,615. The 1 hour of unused labor gives a Labor Usage Variance of $10 and Non- Admin. Overhead Variance of $9. So, the total of all the Variances is: $6,634. Actual profit with ABC is thus: $7924 - $6,634 = $1,290. 120(200-70)+ So, optimal profit is less than earlier profit! Why? Introduction to the Theory of Constraints- An Accounting Example 13
Planning By Using the Theory of Constraints Product-1 Product-2 Product-3 Product-4 Fixed Costs 250 160 145 90 70 80 130 170 200 30 10 70 2 4 3 100 160 130 Demand Current Output Revenue /unit Material Cost /unit Labour Hours/unit Contribution Margin Contruburuin Margin per unit of buttlenek Product-1 generates the highest profit of $50 per unit of consumption of the bottleneck resource, lets produce as much as we can. Resource per unit =2, Total resource available =1000. Capacity = 1000/2 = 500. Demand = 250. Produce Min(250,500 =250. External Constraint. Product 4 generates 250(100) = $25000 financial throughput. 120 60 250 75 5 175 37000 50 40 43.33333 35 Introduction to the Theory of Constraints- An Accounting Example 14
Can HKL Do Better? Capacity used = 2(250) = 500. Remaining capacity = 1000- 500 = 500. Product-3 generates the next highest contribution margin of 43.33 per unit of consumption of the bottleneck resource, lets produce as much as we can. Resource per unit = 3, Total resource available =500. Capacity = 500/3 = 166.67. Demand = 145. Produce Min{145, 166.67} =145. External Constraint. Capacity used = 3(145) = 435. Remaining capacity = 500- 435 = 65. Product-2 generates the next highest contribution margin of 40 per unit of consumption of the bottleneck resource, lets produce as much as we can. Introduction to the Theory of Constraints- An Accounting Example 15
Can HKL Do Better? Resource per unit =4, Total resource available = 45. Capacity = 65/4 = 26.25, let d0 16 Demand = 160. Produce Min{160,16} =16. Internal Constraint. Product 4 generates 250(100) = $25000 financial throughput. Product 3 generates 130(145) = $18850 financial throughput. Product 2 generates 160(16) = $2560 financial throughput. 25000++18850+ 2560 = 46410 46410 - 37000 = 9410 We may produce one less product 3 and make $130 less but save 3 hours of bottleneck. We also had one hour of bottleneck left, that is a total of 4 hours. We can produce one extra unit of product 2 and make $160. Final profit = 9410-130+160= 9440 Introduction to the Theory of Constraints- An Accounting Example 16
Final Analysis Summary: Profit with arbitrary product mix: $4,100 Optimal profit under Standard Costing recommendation: $0 Optimal profit under ABC recomendation: $1,290 Optimal profit with Throughput Accounting: $9,440 Introduction to the Theory of Constraints- An Accounting Example 17
The 5 Step TOC Focusing Process Step 1: Identify the System s Constraint(s) Step 2: Determine how to Exploit the System s Constraints Step 3: Subordinate Everything Else to that Decision Step 4: Elevate the System s Constraints Step 5: If a Constraint Was Broken in previous Steps, Go to Step 1 Performance of subsystems to be linked to the performance of the total system. Introduction to the Theory of Constraints- An Accounting Example 18
Solution ` Demand Revenue /Job Material Cost /Job Labour Hours/Job Hours needed to Satisfy Demand Profit per unit Profit per hour of the buttleneck (binding Constraint) Profitability Priority Cappacity available you can up to demand Profit For more information or practice, and at your own will, you may watch another example at https://www.youtube.com/watch?v=sVyltL7O2KM Product-1 Product-2 Product-3 Product-4 250 160 $130 $170 $30 $10 2 4 Labor hours/month Labor cost /month (5 Workers) Administrative Overhead Non-Administrative Overhead 1000 10000 18000 9000 145 $200 $70 3 120 $250 $75 5 500 $100 640 $160 435 $130 600 $175 2175 We cannot safsfy all demand $50 1 1000 $40 3 65 $43 2 500 $35 4 250 16.25 $2,600 145 $25,000 $18,850 $0 $46,450 Maximum profitability Introduction to the Theory of Constraints- An Accounting Example 19
Introduction to the Theory of Constraints- An Accounting Example 20
A Feasible Production Plan ` Demand Revenue /Job Material Cost /Job Labour Hours/Job Product-1 Product-2 Product-3 Product-4 250 160 $130 $170 $30 $10 2 4 Labor hours/month Labor cost /month (5 Workers) Administrative Overhead Non-Administrative Overhead 1000 10000 18000 9000 145 $200 $70 3 120 $250 $75 5 For a more comprehensive talk on application of TOC in Product Mix you may watch my other lecture at https://www.youtube.com/watch?v=sVyltL7O2KM Introduction to the Theory of Constraints- An Accounting Example 21
Linear Programming and Solver Prod-1 Prod-2 Prod-3 Prod-4 37000 Labour Hours/unit Market-Prod-1 Market-Prod-2 Market-Prod-3 Market-Prod-4 Contribution /unit Production 2 1 4 3 5 999 1000 250 160 145 120 F3 F4 F5 F6 F7 =SUMPRODUCT(B3:E3,$B$9:$E$9) =SUMPRODUCT(B4:E4,$B$9:$E$9) =SUMPRODUCT(B5:E5,$B$9:$E$9) =SUMPRODUCT(B6:E6,$B$9:$E$9) =SUMPRODUCT(B7:E7,$B$9:$E$9) 0 0 1 1 133 120 1290 1 100 160 130 133 175 120 0 0 Current Standard Costing ABC Throughput Accounting 90 70 80 60 4100 100 120 120 0 133 1290 Introduction to the Theory of Constraints- An Accounting Example 22


