Tiling Solutions for Pixel TPC Read-Out Modules
Explore the tiling strategies and solutions for the Pixel TPC read-out modules with detailed examples of simple and complex configurations. Learn about quad placement, insensitive areas, and guard structures for optimal performance in particle detection systems.
Download Presentation

Please find below an Image/Link to download the presentation.
The content on the website is provided AS IS for your information and personal use only. It may not be sold, licensed, or shared on other websites without obtaining consent from the author. If you encounter any issues during the download, it is possible that the publisher has removed the file from their server.
You are allowed to download the files provided on this website for personal or commercial use, subject to the condition that they are used lawfully. All files are the property of their respective owners.
The content on the website is provided AS IS for your information and personal use only. It may not be sold, licensed, or shared on other websites without obtaining consent from the author.
E N D
Presentation Transcript
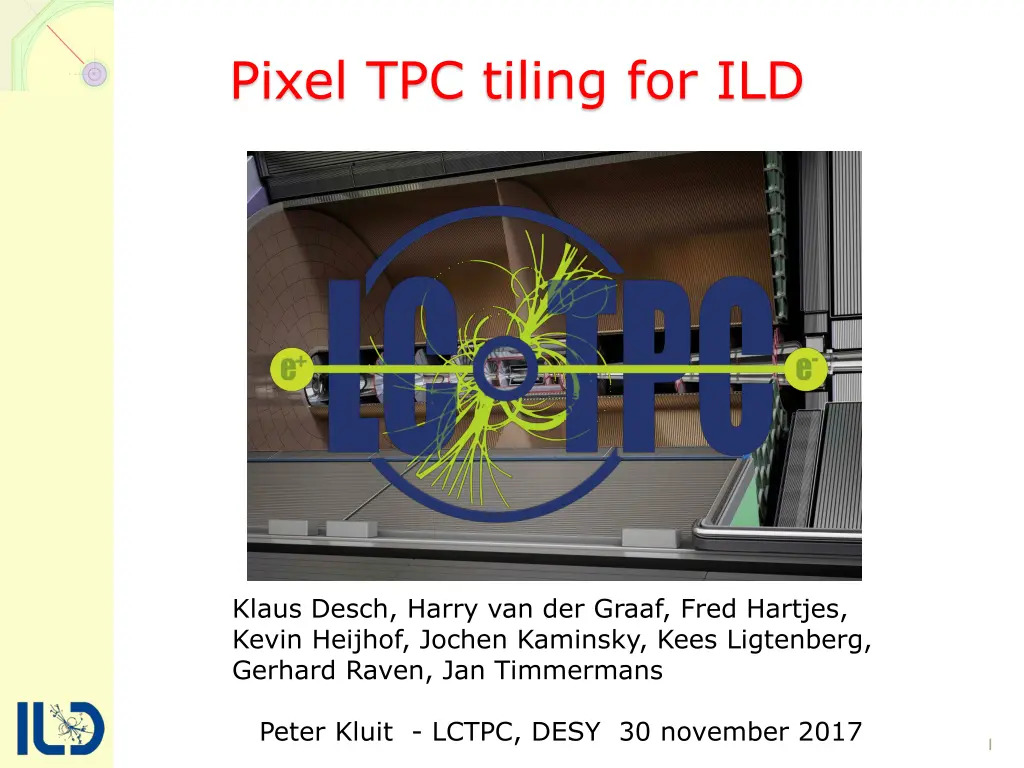
Pixel TPC tiling for ILD Klaus Desch, Harry van der Graaf, Fred Hartjes, Kevin Heijhof, Jochen Kaminsky, Kees Ligtenberg, Gerhard Raven, Jan Timmermans Peter Kluit - LCTPC, DESY 30 november 2017 1
Tiling of the TPC read-out Basic building block is the quad - width 28.4 mm height = 39.6 mm Sensitive area width and height 2 x 256 x 0.055 mm New TPC dimensions Rin = 354 mm Rout = 1768.8-55 mm Nr. Of Modules in 8 (radial) rows 14, 18, 23, 28, 32, 37, 42, 46 2
Tiling of the TPC read-out Solving the maximum number of quads per quad row number in the module. Putting the quads on a straight line: Row 8 8 7 7 7 (8 large radius) Row 5,6,7 7 7 7 7 Row 4 ,3 7 7 7 6 Row 2 7 7 6 6 Row 1 7 6 6 5 R (row, height) phi (width) Most simple solution is just start tiling in the center and leave uncovered space at the module edges. Another solution suggested by Jan - is to leave no space at the edges and allow space between quad nr 6-5 nr 5-4 nr 4-3 nr 3-2 (quadrow bottom to top). This avoids an insensitive zone at the edge of a module. 3
Tiling of the TPC read-out Example of module most inner row Simple solution Complex solution In dark blue Module edges Light blue empty space (in between/edge) Green between two quads Purple inside quad (guard above wirebonds) 4
Tiling of the TPC read-out Simple solution Insensitive areas In light blue Module edge Green between two quads Purple inside quad (guard) 5
Tiling of the TPC read-out Complex solution Insensitive areas In light blue Module edge Green between two quads Purple inside quad (guard) 6
Tiling of the TPC read-out Simple solution Insensitive areas In light blue Module edge 7
Tiling of the TPC read-out Complex solution Insensitive areas In light blue Module edge 8
Tiling of the TPC read-out complex solutions hits per track Two options: Staggered geometry Phi module rotating vs row slightly better phi coverage 9
Summary:Tiling of the TPC read-out Quad surface 1124.64 mm2 Quad coverage 0.696839 Total quads Total quad sensitive surface Total read-out surface Total read-out plane coverage 0.586865 - Most of the coverage loss (30%) is due to the guard board between the chip pairs. This board covers the TPX3 chip wire bonding pads. - Only a relative 15% loss is due to the rectangular tiling on a cylindrical disc. - Note that some optimization can be done by adjusting the module height and the nr of modules per row. - Best solution avoiding aligned dead zones - is the complex tiling with phi module rotating - This layout describes a realistic TPX3 pixel read-out of the TPC that includes all the dead space that can be 1-1 compared to a pad read-out plane (that also now includes dead space). Coverage = 58.6% 10
Pixel TPC dEdx Klaus Desch, Harry van der Graaf, Fred Hartjes, Kevin Heijhof, Jochen Kaminsky, Kees Ligtenberg, Gerhard Raven, Jan Timmermans Peter Kluit - LCTPC, DESY 30 november 2017 11
dEdx by charge and clusters Energy loss can be measured from the charge e.g. using a pad read out scheme. However a pixel TPC allows an identification of the primary clusters as well as the charge from the total number of electrons (pixels). - Cluster counting a Poissonian distribution; - Charge measurement a Landau like distribution with a long tail from secondary electrons and deltas. Michael Hausschild ILC Tracking 2006 has shown that cluster counting can significantly improve the dEdx separation up to a factor 2. Note that the mean measured dEdx is different for both methods. And depends on gas. 12
dEdx by charge and clusters Comparison of the two methods is not trivial. The dEdx is e.g. not a good measure: this e.g. a lot smaller for cluster counting than for the charge. The final measure is the pion-Kaon separation in : separation = (dEdx( )-dEdx(K))/ ( ) Method proposed: use the response of electrons and compare it to a 70% efficient electron (by hit dropping). This can be done on test beam data and simulation. One could also think of comparing 4 GeV pions to kaons (as Michael proposed). 13
dEdx for a GridPix detector The dEdx also strongly depends on the gas used, the granularity and efficiency of the device. Further the diffusion in the drift process will smear the primary clusters and affect the capability to isolate in the reconstruction the clusters. For the TPX3 chip the pixel granularity is 55 m; in the T2K gas about 29 primary clusters per cm are made for a MIP. In the GridPix detector this corresponds to (no diffusion): So most of the time (80%) no cluster is expected. Clearly the Landau electron signal has a long tail 14
Test beam data and dEdx Test beam data will be used to study the dEdx performance (see also talk Kees Ligtenberg in this session) Data are taken in the Bonn test beam with a single GridPix detector based on one TPX3 chip using electrons of 2.5 GeV. Tracks were reconstructed using a EUDET silicon beam telescope and the GridPix detector. Selecting tracks that cross the detector the following procedure was followed: The maximum nr of pixels crossed is 256 (x 55 m). The fully efficient region has a size of 220 pixels. In that range the hits associated to the track are projected along the track in the pixel plane and binned in 55 micron bins. Associated hits lie with 2 (pixel) and 3 (drift) sigma in both measurement planes. Mean resolution in pixel plane 250 m run 347 is taken with 350 V grid voltage 15
G4 simulation samples Geant4 was used to simulate different samples. The ILD TPC pixel simulation was used for this purpose. (see Kees Ligtenberg LCTPC 11 May 2017) - 2.5 GeV electrons without B field. With a detailed simulation of the ionization with a step length of 55 m; - 250 GeV muons and in a 4 T B field; here a larger step length of 18 pixels was used interpolating the Eloss. - both samples were generated at =85 degrees; - The resolution in xy per hit in the simulation for this drift distance is 350 m (default ILD diffusion values for B=4 T) Also samples with the truth hit position without diffusion were made for the two samples. 16
Test beam data hits Data run 347 300 k tracks Below the total nr of hits associated to the track (for one chip). Data compared to the G4 electron sample. One can observe that the data is more smeared around the MOP (most probable value). 17
Test beam dEdx variables The following array of information is used: All the hits associated to the track are projected along the track into the pixel plane. Each pixel can only contribute 1. A typical event is 220 pixels long (efficient region): 0 1 5 1 0 0 0 2 2 0 1 0 0 1 1 0 6 3 0 etc. From this one can calculate: - The multiplicities 0, 1, 5, 1, etc. - Distance between subsequent hits More complicated are the cluster variables: - cluster width and maximum: between two zero s 1 5 1 -> width = 3 and max = 5 2 2 -> width = 2 and max = 2 18
Details: Test beam data multiplicity Here the distribution for data and G4 MC for cluster multiplicity (so nr of hits in the particular bin) along the track. - data One can observe that in simulation there are more events with large (>5) multiplicities. Data has more clusters 2-4 19
Details: Test beam data distance Here the distribution for data and G4 MC for the distance between subsequent hits along the track in the pixel plane. - data One can observe that in the data there are more events with large distances. The slope is very sensitive to the mean number of primary clusters. In G4 this number is too large by about a factor of 1.5 20
Details: Test beam data cluster width Here along the tracks isolated clusters are looked for and there width (how long along the track) vs max nr of hits in one bin. One can observe that the distributions in simulation and data have similar shapes. 21
Details: Test beam data cluster width There is a reasonable modeling of the cluster width and max cluster multiplicity (mind linear scale). 22
Test beam dEdx algorithms Truncated hits algorithm to calculate the total hits (electrons) truncated. Use the method proposed by Michael Lupberger to make 20 pixel samples. So 11 samples per track. Then only the 70 percent lowest samples are used to measure the total nr of hits. The full performance of a Pixel TPC is obtained by combining 8 (rows) times 9 (chips per module). 23
Test beam dEdx truncated hits Truncated nr of hits for data and G4 for one chip. The distribution in data has more spread and a lower average. To get rid of the Landau tail one has to add more samples NB this corresponds to 1.1 cm pad 24
Test beam dEdx truncated hits Truncated mean nr of hits for data for 72 chips. Performances dEdx: mean rms reso (%) data 2491 112 4.5 G4 3340 120 3.6 NB track length 72*220*55 m or 87 cm while full TPC 133 cm Took a realistic (pessimistic) coverage including dead zones for the Pixel TPC. 25
Test beam dEdx algorithms Clusters zero algorithm method counts all hits between two zero s as 1 So the typical event: 0 1 5 1 0 0 0 2 2 0 1 0 0 1 1 0 6 3 0 etc. 1 1 1 1 1 So in total 5 clusters. Clusters 1 algorithm method counts all hits as 1 cluster 0 1 5 1 0 0 0 2 2 0 1 0 0 1 1 0 6 3 0 etc. 1 1 1 1 1 1 1 1 1 1 One can think of smarter algorithms that looks at the hits between zero s and then fits a peak and assigns a cluster count depending on the cluster width and peak height. 26
Test beam dEdx clusters zero Cluster zero hits for data and G4 for one chip. The distribution has clearly less Landau tail! And also a quite small rms. 27
Test beam dEdx clusters zero Cluster zero hits for data and G4 for 72 chips. Performances dEdx: mean rms reso (%) data 2481 45 1.8 G4 3254 43 1.3 NB track length 72*220*55 m or 87 cm while full TPC 133 cm 28
Test beam dEdx clusters 1 Cluster 1 hits for data and G4 for one chip. The distribution has more Landau tail than zero but less than the truncated hits 29
Test beam dEdx clusters 1 Cluster 1 hits for data and G4 for 72 chips. Performances dEdx: mean rms reso (%) data 4796 138 4.4 G4 5368 144 2.7 NB track length 72*220*55 m or 87 cm while full TPC 133 cm 30
Separation: algorithm performance As I stated in the beginning of the talk. The dEdx resolution is not the whole story. The cluster zero algorithm has a high resolution. But is it really the best performant? The way to address this question is by measuring the separation. This can be done by using the data and the simulation and dropping hits with an efficiency of 70%. This case corresponds to something like e/K separation at 2 GeV. So before concluding anything on the dEdx performance this study has to be performed. Results will be presented on the next slides. 31
Separation: dEdx results I separation = (dEdx(e)-dEdx(0.7*e))/ (e) Data results algorithm difference error separation Trunc hits 786. 111. 7.0 clusterz 283. 45. 6.2 cluster1 1063. 138. 7.6 G4 MC results Trunc hits 1070. 120. 8.9 clusterz 474. 43. 10.9 cluster1 1302. 144. 9.0 NB a 5% (dEdx) for electrons corresponds to 6.0 So the difference between the three algorithms is not that large. The simulation is a factor 1.2-1.7 too optimistic. Can we do better? E.g. combining cluster z and 1 ? 32
Separation: dEdx results II Made simple linear combinations and optimized; clusterc1 = clusterz + 0.5 cluster1 clusterc2 = (clusterc1 + 2 trunc)/3 Data results algorithm difference error separation Trunc hits 786. 111. 7.0 clusterz 283. 45. 6.2 cluster1 1063. 138. 7.6 clusterc1 815. 99. 8.2 clusterc2 1330. 120. 11.0 G4 MC results Trunc hits 1070. 120. 8.9 clusterz 474. 43. 10.9 cluster1 1302. 144. 9.0 clusterc1 1125. 97. 11.6 clusterc2 1636. 117. 14.1 - a 5% (dEdx) for electrons corresponds to 6.0 - clusterc2 data would then correspond to =2.7% 33
Separation: dEdx results III One can wonder how well the numbers extrapolate to a full ILD TPC and whether the results are: 1) Sensitive to the diffusion generate electrons 2.5 GeV without diffusion 2) Sensitive to the particle type generate muons 250 GeV with diffusion G4 MC results electron no diff muon separation Trunc hits 1070. 120. 8.9 9.1 11.9 clusterz 474. 43. 10.9 12.6 10.4 cluster1 1302. 144. 9.0 9.4 11.1 clusterc1 1125. 97. 11.6 11.1 13.2 clusterc2 1636. 117. 14.1 14.2 18.1 One can conclude that there is a weak sensitivity to diffusion for the combined clusters. Clusterz as expected is more sensitive. The muon provides more separation due to the higher nr of hits (radiation). 34
Summary: dEdx performance The simulation of dEdx in G4 needs further understanding. In general the dEdx in G4 has less fluctuations and the TPC dEdx resolutions are smaller by a factor of 1.3. One can further see that too frequently large clusters with a small width are produced. Using the test beam data several events are combined to extrapolate to the full TPC performance. The dEdx extrapolations are conservative and take into account dead space in the pixel TPC module - Pixel active track length 8 (padrows)*9*220 pix = 87 cm - while full TPC track length = 133 cm Several algorithms were developed using the truncated number of hits, the cluster zero and one counts. The performance of the different algorithms is measured using the electron data comparing that to data with a 70% efficiency. 35
Summary: dEdx performance The current - best algorithm combines cluster counting and the number of truncated hits. To quantify the performance we use: separation = (dEdx(e)-dEdx(0.7*e))/ (e) ( e-K at 2 GeV) A 5% (dEdx) the benchmark for the ILD TPC - for electrons corresponds to 6.0 . The best algorithm gives on data a separation of 11 . This corresponds to a (dEdx) =2.7%. The results for the combined algorithms separation are similar within a relative 10% if the diffusion is put to zero. Muons with 250 GeV provide a higher separation factor 1.3. We can therefore conclude that a realistic pixel TPC will provide a separation of 11 corresponding to a (dEdx) of 2.7%. Pattern recognition exploiting the cluster shape and machine learning can probably improve on this result. 36


