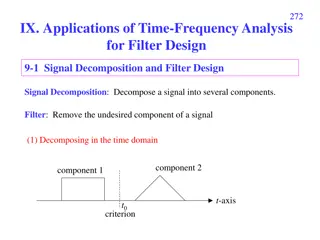
Time-Frequency Characterization of Signals and Systems
This content delves into the magnitude, phase, time shift, sinusoidals, signals examples, Fourier transforms, and system characteristics related to signals and systems, providing insights into their analysis and behavior in the time and frequency domains.

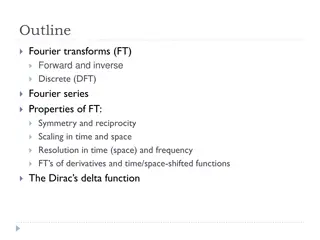
Download Presentation

Please find below an Image/Link to download the presentation.
The content on the website is provided AS IS for your information and personal use only. It may not be sold, licensed, or shared on other websites without obtaining consent from the author.If you encounter any issues during the download, it is possible that the publisher has removed the file from their server.
You are allowed to download the files provided on this website for personal or commercial use, subject to the condition that they are used lawfully. All files are the property of their respective owners.
The content on the website is provided AS IS for your information and personal use only. It may not be sold, licensed, or shared on other websites without obtaining consent from the author.
E N D
Presentation Transcript
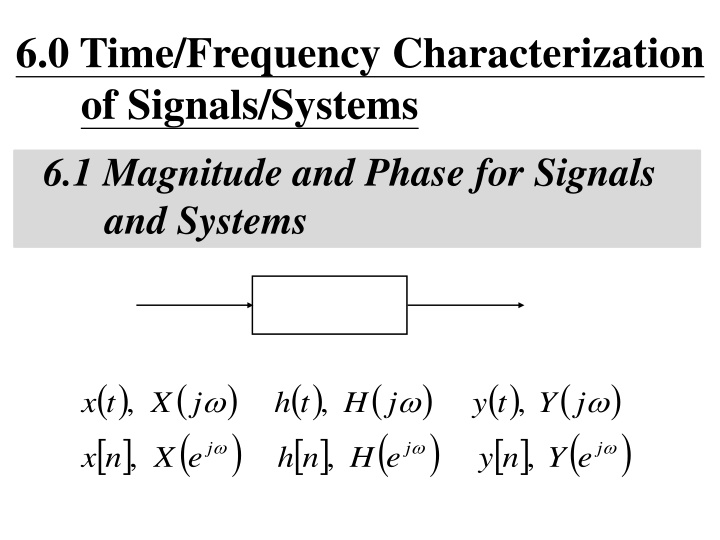
6.0 Time/Frequency Characterization of Signals/Systems 6.1 Magnitude and Phase for Signals and Systems ( ) n x ( ( ) ) ( ) n h ( ) ( ) n y ( ) j j j , , , x t X h t H y t Y ( ) ( ) j j j , , , X e H e Y e
Signals ( ) ( ) ( ) j j = j je X X X ( ) j X : magnitude of each frequency component ( ) j X : phase of each frequency component
Time Shift (P.20 of 4.0) ?? ?? ?? ?? ?? ?? ?
Sinusoidals (p.68 of 4.0) ?? ? ? ?0 + ? ? + ?0 , 1 2[???0?+ ? ??0?] cos?0? ?? 1 2?[???0? ? ??0?] sin?0? ?? ? ?0 ? ? + ?0 , cos?0(? ?0) ?? sin?0? ?0 ?? ?0 cos?0? ? ??0? ?(??) ? ? ?0 ?
Signals Example ( ) t X 1 2 ( ) ( ) ( ) = + + + + + + 1 cos 2 cos 4 cos 6 t t t 1 2 3 2 3 See Fig. 3.4, p.188 and Fig. 6.1, p.425 of text change in phase leads to change in time-domain characteristics human auditory system is relatively insensitive to phase of sound signals
Signals Example : pictures as 2-dim signals ( ) signals dim - 2 : ,2 t x ( ) 2 1 , j j X 1t ( ) ( ) + = j t t , x t t e dt dt 1 1 2 2 1 2 1 2 ( ) j j = t t , x t t e dt e dt 1 1 2 2 1 2 1 2 ( ) j X 1 t 2 most important visual information in edges and regions of high contrast regions of max/min intensity are where different frequency components are in phase See Fig. 6.2, p.426~427 of text
Systems ( j Y ) ( ) ( ) = j j X H ( ) ( ) ( ) j = j + j log Y log log X H ( ) ( ) ( ) j = j + j Y X H ( ) j H : scaling of different frequency components ( ) j H : phase shift of different frequency components
Systems Linear Phase (phase shift linear in frequency) means constant delay for all frequency components ( ) n ( ) ( ) ( ) = = = j t , y t x t t H j e H j t 0 0 0 ( ) ( ) = = = j n j , y x n n H e e H j n 0 0 0 slope of the phase function in frequency is the delay a nonlinear phase may be decomposed into a linear part plus a nonlinear part
Time Shift(P.19 of 4.0) Time Shift ( t x linear phase shift (linear in frequency) with amplitude unchanged ) ( ) j F j t t e X 0 0
Linear Phase for Time Delay ? ?? , (?) ?(?) ? ? = ?(? ?0) Delay ?0 ? ?? = ? ???0 ?(??) ? ?? = ? ???0 ??0 1 ? = ?(? ?0) ?(??) ?(??) ? ? ???0 ?(? ?0) ? ? ? ?0 0 Scope= ?0
(P.20 of 4.0) Time Shift ?? ?? ?? ?? ?? ?? ?
Systems Group Delay at frequency ( ) d common delay for frequencies near ( ) d = j H
Systems Examples See Fig. 6.5, p.434 of text Dispersion : different frequency components delayed by different intervals later parts of the impulse response oscillates at near 50Hz Group delay/magnitude function for Bell System telephone lines See Fig. 6.6, p.435 of text
Systems Bode Plots log H ( ) , ( ) j j vs. log H Discrete-time Case not in log scale, finite within [ - , ] Condition for Distortionless n ( ) t ( ) = = 0 , y kx t t y kx n n 0 Constant magnitude plus linear phase in signal band
Distortionless ?(?) ?(?) ?(??) ? ?? = ? ?? ?(??) ?(??) ? Signal band
6.2 Filtering Ideal Filters Low pass Filters as an example Continuous-time or Discrete-time See Figs. 6.10, 6.12, pp.440,442 of text mainlobe, sidelobe, mainlobe width 1 c
Filtering of Signals(p.55 of 4.0) 1 1 1 0 ?(??) ?(??) ?(?) ? ? ? 0 ? ?(??) 0
Ideal Filters Low pass Filters as an example with a linear phase or constant delay See Figs. 6.11, 6.13, pp.441,442 of text causality issue implementation issues
Realizable Lowpass Filter (p.58 of 4.0) ? ?1(??) 1(?) ? ?2(??) ?2(??) 2(?) ? ? ? 0 ? 0 2? ? 0
Ideal Filters Low pass Filters as an example step response n m h n ( ) t ( ) h t = m = d = , s s See Fig. 6.14, p.443 of text 1 overshoot, oscillatory behavior, rise time c
Nonideal Filters Frequency Domain Specification (Lowpass as an example) 1(passband ripple), 2(stopband ripple) magnitude characteristics p(passband edge), s(stopband edge) s- p(transition band) phase characteristics See Fig. 6.16, p.445 of text
1(passband ripple), 2(stopband ripple) magnitude characteristics p(passband edge), s(stopband edge) s- p(transition band)
Nonideal Filters Time Domain Behavior : step response tr(rise time), (ripple), (overshoot) r(ringing frequency), ts(settling time) See Fig. 6.17, p.446 of text
tr(rise time), (ripple), (overshoot) r(ringing frequency), ts(settling time)
Nonideal Filters Example: tradeoff between transition band width (frequency domain) and settling time (time domain) See Fig. 6.18, p.447 of text
Nonideal Filters Examples M n 1 M = k = y x n k + + 1 N N ( ) ( ) + + sin 1 / 2 M N 1 M ( ) j j = / 2 N M H e e ( ) 2 + + 1 sin / N linear phase See Figs. 6.35, 6.36, pp.478,479 of text A narrower passband requires longer impulse response
Nonideal Filters Examples A more general form n y k M = b x n k k = N ( ) sin 2 / 33 k k h = = , 32 b k k k = 0 , 32 k See Figs. 6.37, 6.38, p.480,481 of text A truncated impulse response for ideal lowpass filter gives much sharper transition See Figs. 6.39, p.482 of text very sharp transition is possible
Nonideal Filters To make a FIR filter causal ( ) H e H = 1 = , 0 n h n N = h n h n N 1 ( ) j j j N e e
6.3 First/Second-Order Systems Described by Differential/Difference Equations Higher-order systems can usually be represented as combinations of 1st/2nd-order systems Continuous-time Systems by Differential Equations first-order ( ) ( ) ( ) t x t y dt dy t + = second-order d m ( ) t ( ) t 2 y dy ( ) t ( ) t = x ky b 2 dt dt See Fig. 6.21, p.451 of text
Discrete-time Systems by Differential Equations first-order x n ay n y = 1 n See Fig. 6.26, 27, 28, p.462, 463, 464, 465 of text second-order n y n x + = 2 2 cos 1 2 r y n r y n


")


")

")


")
")
")


, δ2(stopband ripple)")

, δ(ripple), ∆(overshoot)")