Tooth Pain in North Dakota: 2020-2024 Summary
This report summarizes tooth pain data from 2020-2024 in North Dakota, compiled from ND ESSENCE. It includes the number and rate of tooth pain events by year, sex, and age group, providing insights into trends and patterns in emergency department visits related to tooth pain.
Download Presentation

Please find below an Image/Link to download the presentation.
The content on the website is provided AS IS for your information and personal use only. It may not be sold, licensed, or shared on other websites without obtaining consent from the author.If you encounter any issues during the download, it is possible that the publisher has removed the file from their server.
You are allowed to download the files provided on this website for personal or commercial use, subject to the condition that they are used lawfully. All files are the property of their respective owners.
The content on the website is provided AS IS for your information and personal use only. It may not be sold, licensed, or shared on other websites without obtaining consent from the author.
E N D
Presentation Transcript
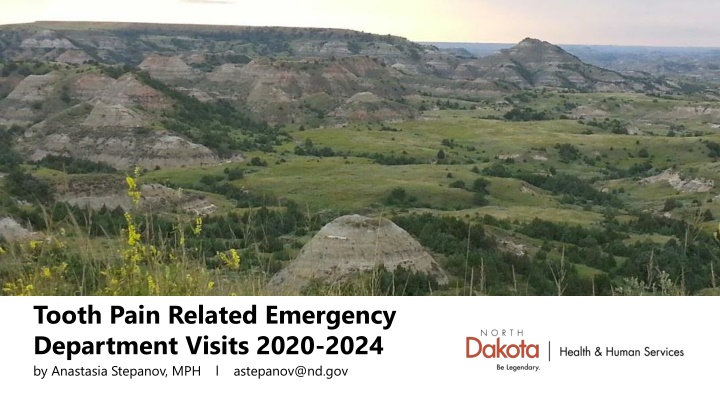
Tooth Pain Related Emergency Department Visits 2020-2024 by Anastasia Stepanov, MPH l astepanov@nd.gov
North Dakota ESSENCE This report provides a summary of tooth pain data compiled from ND ESSENCE, an electronic surveillance system that consists of emergency department, urgent care and walk-in-clinic visit information from 2020-2024. The ICD-9-CM and ICD-10-CM codes used for this analysis was 525.9, K08.8, K08.9, and K08.89 with the search words dental pain , tooth pain , toothache , dental problem , disorder of teeth . Please note the caveats of these data: These numbers represent a syndrome definition that utilizes both ICD-10 codes and chief complaint which looks for key words. These should not be considered a true number of cases. Syndromes may also contain noise meaning that the syndrome data may count actual non-tooth pain-related events. Not every hospital submits both ICD and chief complaint, so some visits may be missing. Some hospitals only submit data on ND residents. Transient populations may not be included; therefore, underestimating the impact. Increase in number may be due to actual increases or it may be due to increase in number of facilities participating.
Number of Tooth Pain Events by Year North Dakota 2020-2024 4715 5000 4500 3717 4000 3500 3165 2874 3000 2625 2500 2000 1500 1000 500 0 2020 2021 2022 2023 2024 Source: North Dakota ESSENCE
Rate of Tooth Pain Events North Dakota 2020-2024 700 591.9 600 474.2 500 406.3 370.9 343.0 400 300 200 100 0 2020 2021 2022 2023 2024 Source: North Dakota ESSENCE
Tooth Pain Events by Sex North Dakota 2020-2024 60% 54% 52% 51% 50% 50% 50% 50% 49% 48% 46% 50% 40% 30% 20% 10% 0% 2020 2021 2022 2023 2024 Female Male Source: North Dakota ESSENCE
Rate of Tooth Pain Events by Sex North Dakota 2020-2024 800 674.4 700 600 511.3 500 542.9 415.1 384.4 362.2 400 444.2 400.2 358.2 300 329.1 200 100 0 2020 2021 2022 2023 2024 Female Male Source: North Dakota ESSENCE
Tooth Pain Events by Age Group North Dakota 2020-2024 40% 35% 34% 31% 30% 30% 30% 29% 25% 25% 24% 24% 23% 21% 20% 15% 13% 13% 12% 12% 12% 12% 11% 11% 11% 10% 10% 9% 8% 8% 8% 8% 8% 8% 7% 7% 6% 5% 5% 4% 4% 5% 4% 4% 3% 3% 2% 2% 0% 0-17 18-24 25-34 35-44 45-54 55-64 65-74 75+ 2020 2021 2022 2023 2024 Source: North Dakota ESSENCE
Percent of Tooth Pain Events by Race North Dakota 2020-2024 80 70.1 70 60 50 40 30 20 13.1 8.5 6.3 10 1.1 0.6 0.3 0.1 0 American Indian or Alaska Native Asian Multiracial Native Hawaiian or Other Pacific Islander Black or Africn American Other Race White Unknown *190 events had no race reported (n=164) Source: North Dakota ESSENCE
Rate of Tooth Pain Events by Race per 100,000 Population North Dakota 2020-2024 8000 6,767.8 7000 5,971.5 5,710.6 6000 5000 4000 3000 1,748.9 2000 836.5 1000 30.2 0 American Indian or Alaska Native Asian Multiracial Native Hawaiian or Other Pacific Islander Black or Africn American White *190 events had no race reported - 2021 population estimates were used - Only looked at single race for analysis Source: North Dakota ESSENCE
Tooth Pain Events by Month and Year 2020-2024 50% 45% 40% 8.0% 8.1% 8.7% 8.0% 8.3% 8.7% 9.4% 8.3% 8.5% 8.7% 35% 6.9% 8.5% 8.8% 8.4% 7.3% 30% 10.5% 9.9% 8.2% 7.6% 8.2% 7.8% 8.4% 7.2% 7.7% 25% 9.1% 9.4% 9.0% 7.9% 9.0% 7.9% 7.1% 9.0% 8.7% 20% 7.1% 7.8% 7.8% 15% 8.6% 8.0% 9.4% 8.6% 8.0% 7.5% 9.1% 8.4% 7.9% 8.1% 8.5% 10% 7.9% 5% 9.2% 9.1% 9.0% 8.9% 8.8% 8.4% 8.3% 8.3% 8.3% 8.0% 7.7% 6.1% 0% Jan Feb Mar Apr May Jun Jul Aug Sep Oct Nov Dec 2020 2021 2022 2023 2024 Source: North Dakota ESSENCE
Tooth Pain Events by Year and Day of the Week 2020-2024 30% 25% 20% 15% 10% 5% 0% Sun Mon Tue Wed Thur Fri Sat 2020 2021 2022 2023 2024
Tooth Pain Events by Year and Time Periods 2020-2024 900 800 700 600 500 400 300 200 100 0 0-2am 3-5am 6-8am 9-10am 11am-1pm 2-4pm 5-7pm 9-11pm 2020 2021 2022 2023 2024
Pierce 200.5 Steele 55.6 Mercer 12.0 Golden Valley 115.2
Steele 166.9
Steele 55.9
Steele 0.0 Golden Valley 299.8
Steele 168.4 Golden Valley 57.4
Type of Visits Associated with Tooth Pain Events North Dakota 2020-2024 100% 91.2% 87.9% 87.3% 90% 83.4% 82.9% 80% 70% 60% 50% 40% 30% 20% 10.4% 9.7% 7.5% 6.9% 6.3% 6.2% 10% 5.8% 5.8% 4.6% 4.2% 0% 2020 2021 2022 2023 2024 Emergency Care Primary Care Urgent Care
