Total Quality Management: Principles and Tools
Dive into the world of Total Quality Management (TQM), exploring quality concepts, quality management, its hard and soft sides, and the foundation principles of TQM. Discover the history, core principles, and the seven basic tools essential for quality improvement.
Download Presentation

Please find below an Image/Link to download the presentation.
The content on the website is provided AS IS for your information and personal use only. It may not be sold, licensed, or shared on other websites without obtaining consent from the author. If you encounter any issues during the download, it is possible that the publisher has removed the file from their server.
You are allowed to download the files provided on this website for personal or commercial use, subject to the condition that they are used lawfully. All files are the property of their respective owners.
The content on the website is provided AS IS for your information and personal use only. It may not be sold, licensed, or shared on other websites without obtaining consent from the author.
E N D
Presentation Transcript
What is Quality? Quality is a relative concept. Quality is in the eye of the beholder Perfection Doing it right at the first time Eliminating Waste
What is Quality Management? Management activities and functions involved in determination of quality policy and its implementation through means such as quality planning and quality assurance (including quality control)
Quality Management has a hard side and a soft side. - Hard side: Statistics,Numbers,etc. - Soft side: Believes,Emotions,etc.
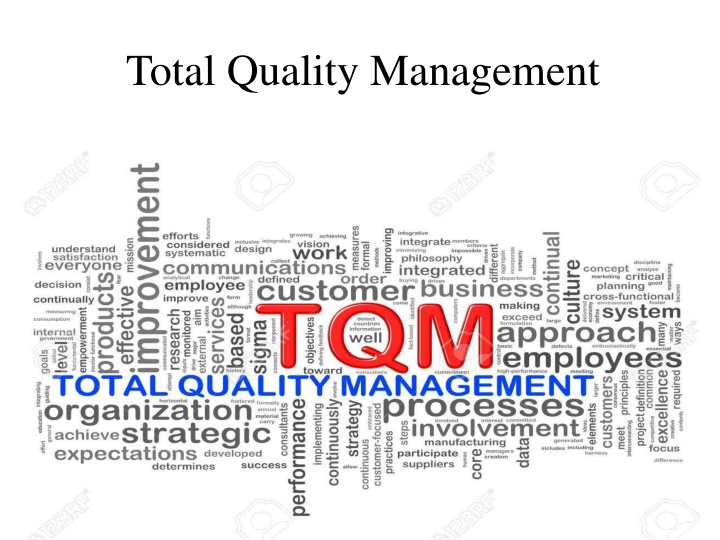
What is Total Quality Management? Total quality management exceeds the product quality approach, involves everyone in the organization, and includes its every function; administration, communication,distribution manufacturing,marketing,planning,training,etc.
Foundation Principles of TQM Customer comes first Employee involvement,education and training The continuous improvement of systems and processes.
The Seven Basic Tools of Quality Cause-and-effect diagram: (also called Ishikawa or fishbone diagram) Identifies many possible causes for an effect or problem and sorts ideas into useful categories. Check sheet:A structured, prepared form for collecting and analyzing data; a generic tool that can be adapted for a wide variety of purposes. Control charts: Graphs used to study how a process changes over time. Histogram: The most commonly used graph for showing frequency distributions, or how often each different value in a set of data occurs. Pareto chart: Shows on a bar graph which factors are more significant. Scatter diagram: Graphs pairs of numerical data, one variable on each axis, to look for a relationship. Stratification: A technique that separates data gathered from a variety of sources so that patterns can be seen (some lists replace stratification with flowchart or run chart)

